This small step towards normalcy has sparked questions around the future of office life—will office culture eventually bounce back to pre-pandemic levels, or is remote work here to stay? It’s impossible to predict the future, but one way to gauge the current state of office life is by looking at foot traffic across city centers in North America. This graphic measures just that, using data from Avison Young.
Change in Downtown Office Traffic
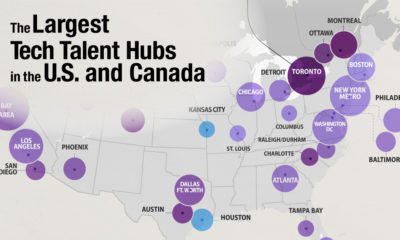
According to the data, which measures foot traffic in major office buildings in 23 different metropolitan hubs across North America, remains drastically below pre-pandemic levels. Across all major cities included in the index, average weekday visitor volume has fallen by 73.7% since the early months of 2020. Here’s a look at each individual city’s change in foot traffic, from March 2, 2020 to Oct 11, 2021: The Canadian city of Calgary is a somewhat unique case. On one hand, foot traffic has bounced back stronger than many other downtowns across North America. On the other hand, the city has one of the highest commercial vacancy rates in North America, and there are existential questions about what comes next for the city. Interestingly, a number of cities with a high proportion of tech jobs, such as Austin, Boston, and San Francisco bounced back the strongest post-pandemic. Of course, there is one noteworthy exception to that rule.
A Tale of Two Cities
Silicon Valley has experienced one of the most significant drops in foot traffic, at -82.6%. Tech as an industry has seen one of the largest increases in remote work, as Bay Area workers look to escape high commuter traffic and high living expenses. A recent survey found that 53% of tech workers in the region said they are considering moving, with housing costs being the primary reason most respondents cited. Meanwhile, in a very different part of North America, another city is experienced a sluggish rebound in foot traffic, but for very different reasons. Ottawa, Canada’s capital, is facing empty streets and struggling small businesses that rely on the droves of government workers that used to commute to downtown offices. Unlike Silicon Valley, where tech workers are taking advantage of flexible work options, many federal workers in Ottawa are still working from home without a clear plan on returning to the workplace. It’s also worth noting that these two cities are home to a lot of single-occupant office buildings, which is a focus of this data set.
Some Businesses Remain Hopeful
Despite a slow return to office life, some employers are snapping up commercial office space in preparation for a potential mass return to the office. Back in March 2021, Google announced it was planning to spend over $7 billion on U.S. office space and data centers. The tech giant held true to its promise—in September, Google purchased a Manhattan commercial building for $2.1 billion.
Will More Employees Return or Stay Remote?
It’s important to note that we’re still in the midst of pandemic recovery, which means the jury’s still out on what our post-pandemic world will look like.
Will different cities and industries eventually recover in different ways, or are we approaching the realities of “new normal” foot traffic in North American city centers?
on
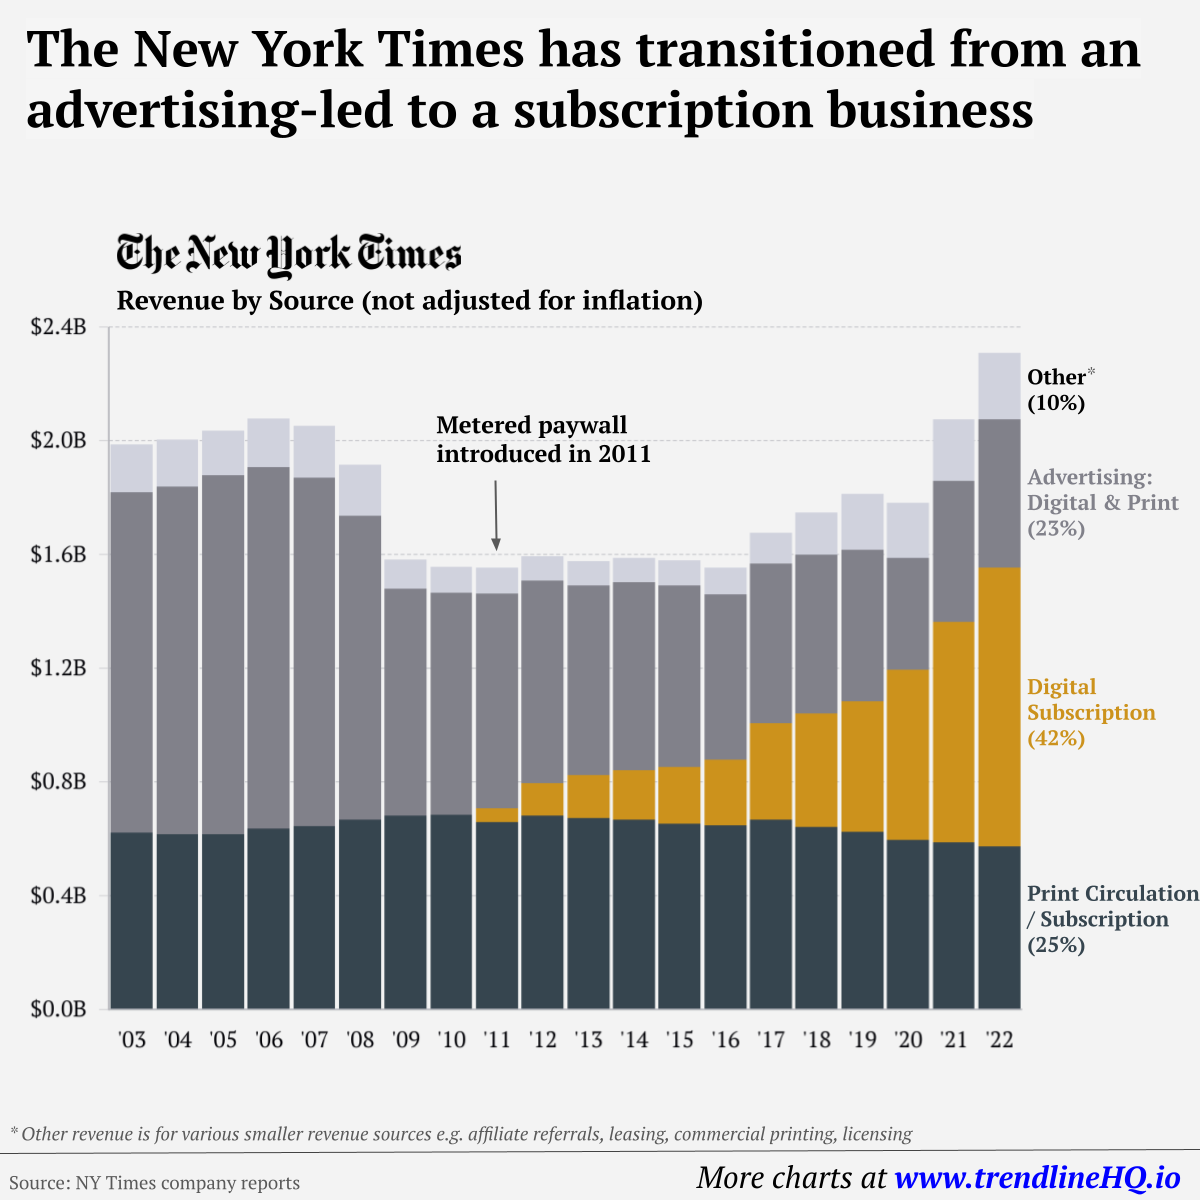
Similar to the the precedent set by the music industry, many news outlets have also been figuring out how to transition into a paid digital monetization model. Over the past decade or so, The New York Times (NY Times)—one of the world’s most iconic and widely read news organizations—has been transforming its revenue model to fit this trend.
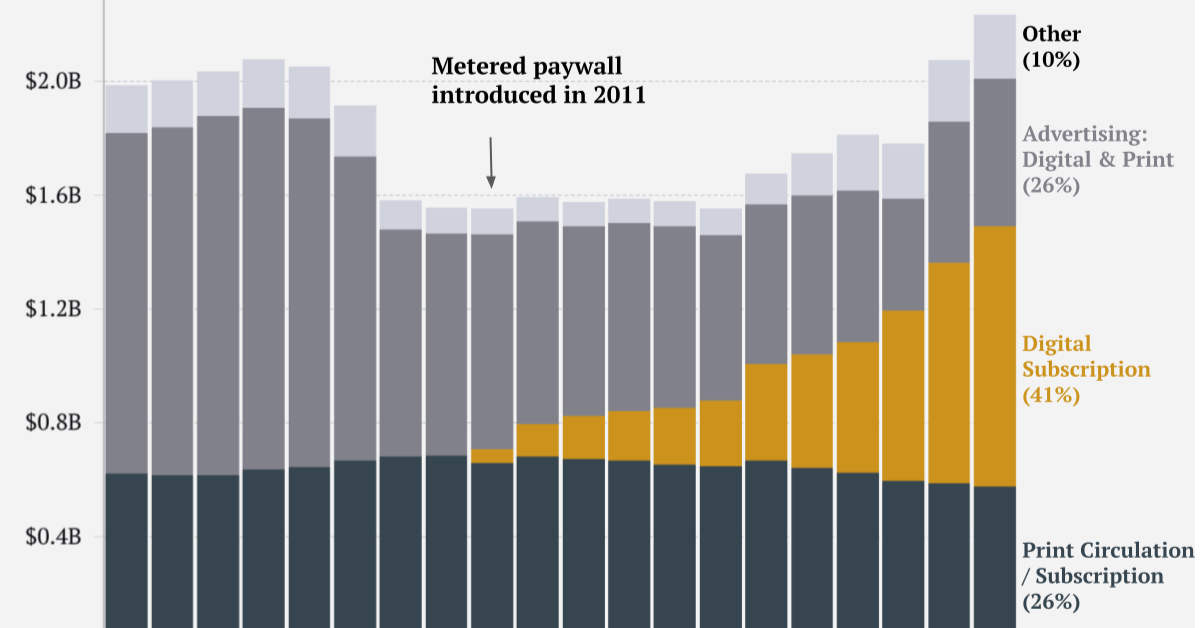
This chart from creator Trendline uses annual reports from the The New York Times Company to visualize how this seemingly simple transition helped the organization adapt to the digital era.
The New York Times’ Revenue Transition
The NY Times has always been one of the world’s most-widely circulated papers. Before the launch of its digital subscription model, it earned half its revenue from print and online advertisements. The rest of its income came in through circulation and other avenues including licensing, referrals, commercial printing, events, and so on. But after annual revenues dropped by more than $500 million from 2006 to 2010, something had to change. In 2011, the NY Times launched its new digital subscription model and put some of its online articles behind a paywall. It bet that consumers would be willing to pay for quality content. And while it faced a rocky start, with revenue through print circulation and advertising slowly dwindling and some consumers frustrated that once-available content was now paywalled, its income through digital subscriptions began to climb. After digital subscription revenues first launched in 2011, they totaled to $47 million of revenue in their first year. By 2022 they had climbed to $979 million and accounted for 42% of total revenue.
Why Are Readers Paying for News?
More than half of U.S. adults subscribe to the news in some format. That (perhaps surprisingly) includes around four out of 10 adults under the age of 35. One of the main reasons cited for this was the consistency of publications in covering a variety of news topics. And given the NY Times’ popularity, it’s no surprise that it recently ranked as the most popular news subscription.