This is particularly true in smaller nations such as Singapore, Switzerland, and the United Arab Emirates, which have all cultivated an investment and tourism-friendly image. Whether it’s attracting talent or wooing investment dollars, highly ranked nation brands can often outperform their rivals in the global marketplace. – David Haigh, CEO, Brand Finance Today’s Chart of the Week uses data from Brand Finance’s Nation Brands report, which attempts to quantify the reputations of various countries around the world.
Quantifying Perception
The report breaks down the methodology in more detail, but here how the scoring system works. Brand Finance uses three pillars to calculate a Brand Strength Index (BSI) score: The BSI score is then used to calculate a hypothetical royalty rate, and to forecast revenues to ultimately derive a brand value (post-tax revenues discounted to calculate a net present value). This calculation produces the “Brand Value” of a country.
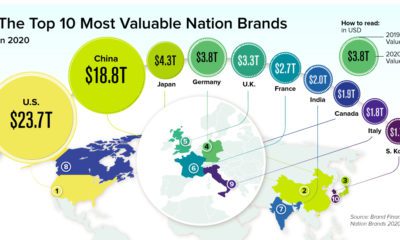
The Most Valuable Nation Brands
One of most impressive gains came from second-ranked China, which is rapidly closing the gap separating them from the United States. China’s brand value surged over 40% to $19.4 trillion — more than the cumulative brand value of the next five countries. Not to be outdone, the United States also posted impressive numbers. Despite being a mature economy, the country’s brand value grew by 7.2% over the last year. Here is the full top 10 list:
Top Countries by Brand Strength
One characteristic of the brand value score is that it’s heavily weighted towards the world’s larger economies. The BSI score, by contrast, may be a more accurate reflection of a government’s guidance of its nation brand as it eliminates the inherent GDP advantage that these bigger economies have. Using the BSI scoring method, Singapore comes out on top — as it has every year since it supplanted Germany in 2015. The highly prosperous city-state serves as the business hub of Southeast Asia and is renowned for its world-class education, healthcare, transport, and low crime levels. These factors, paired with the nation’s unwavering political stability and commitment to its ‘Future Economy’ strategy, makes the island a very strong and stable nation on the global stage. The top 10 strongest nation brands: The United States makes the top 10, but has fallen in the rankings since sitting at fourth place in 2014. That isn’t necessarily an indictment of the U.S. though — the country’s rating has improved somewhat, moving from AA+ to AAA over that same time period. Turkey was one of the success stories of 2019. The country’s BSI score rebounded by nearly 50% after experiencing a large drop in 2018. on Last year, stock and bond returns tumbled after the Federal Reserve hiked interest rates at the fastest speed in 40 years. It was the first time in decades that both asset classes posted negative annual investment returns in tandem. Over four decades, this has happened 2.4% of the time across any 12-month rolling period. To look at how various stock and bond asset allocations have performed over history—and their broader correlations—the above graphic charts their best, worst, and average returns, using data from Vanguard.
How Has Asset Allocation Impacted Returns?
Based on data between 1926 and 2019, the table below looks at the spectrum of market returns of different asset allocations:
We can see that a portfolio made entirely of stocks returned 10.3% on average, the highest across all asset allocations. Of course, this came with wider return variance, hitting an annual low of -43% and a high of 54%.
A traditional 60/40 portfolio—which has lost its luster in recent years as low interest rates have led to lower bond returns—saw an average historical return of 8.8%. As interest rates have climbed in recent years, this may widen its appeal once again as bond returns may rise.
Meanwhile, a 100% bond portfolio averaged 5.3% in annual returns over the period. Bonds typically serve as a hedge against portfolio losses thanks to their typically negative historical correlation to stocks.
A Closer Look at Historical Correlations
To understand how 2022 was an outlier in terms of asset correlations we can look at the graphic below:
The last time stocks and bonds moved together in a negative direction was in 1969. At the time, inflation was accelerating and the Fed was hiking interest rates to cool rising costs. In fact, historically, when inflation surges, stocks and bonds have often moved in similar directions. Underscoring this divergence is real interest rate volatility. When real interest rates are a driving force in the market, as we have seen in the last year, it hurts both stock and bond returns. This is because higher interest rates can reduce the future cash flows of these investments. Adding another layer is the level of risk appetite among investors. When the economic outlook is uncertain and interest rate volatility is high, investors are more likely to take risk off their portfolios and demand higher returns for taking on higher risk. This can push down equity and bond prices. On the other hand, if the economic outlook is positive, investors may be willing to take on more risk, in turn potentially boosting equity prices.
Current Investment Returns in Context
Today, financial markets are seeing sharp swings as the ripple effects of higher interest rates are sinking in. For investors, historical data provides insight on long-term asset allocation trends. Over the last century, cycles of high interest rates have come and gone. Both equity and bond investment returns have been resilient for investors who stay the course.