This particular one shows the total estimated energy consumption in the United States in 2015, and how energy flowed from source to the final destination. The graphic comes to us from the Lawrence Livermore National Laboratory and the Department of Energy. The beauty of a Sankey is in its simplicity and and effectiveness. No information is left out, and we can really see the full energy picture from a 10,000 foot view.
Wasted Effort
The U.S. is estimated to have consumed 97.5 quads of energy in 2015. What’s a quad? It’s equal to a quadrillion BTUs, which is roughly comparable to any of these:
8,007,000,000 gallons (US) of gasoline 293,071,000,000 kilowatt-hours (kWh) 36,000,000 tonnes of coal 970,434,000,000 cubic feet of natural gas 25,200,000 tonnes of oil 252,000,000 tonnes of TNT 13.3 tonnes of uranium-235
It’s a lot of energy – and if you look at the diagram, you’ll see most of it is actually wasted. It’s estimated that 59.1 quads (60.6% of all energy) is “rejected energy”, a fancy term for energy that is produced but not used in an effective way. For example, when gasoline is burned in a car, most of the energy comes off as heat instead of doing productive work (ie. turning the crank shaft). The average internal combustion engine is only 20% efficient, and people get excited even when they approach 40% efficiency. While gas engines are horribly inefficient, so are other energy sources. If you look at electricity production on the diagram, you’ll see that 67% of all energy going to generate electricity is wasted. It’s the laws of physics, but there are still many areas for improvement to increase this efficiency.
A Long Way to Go for Green Energy
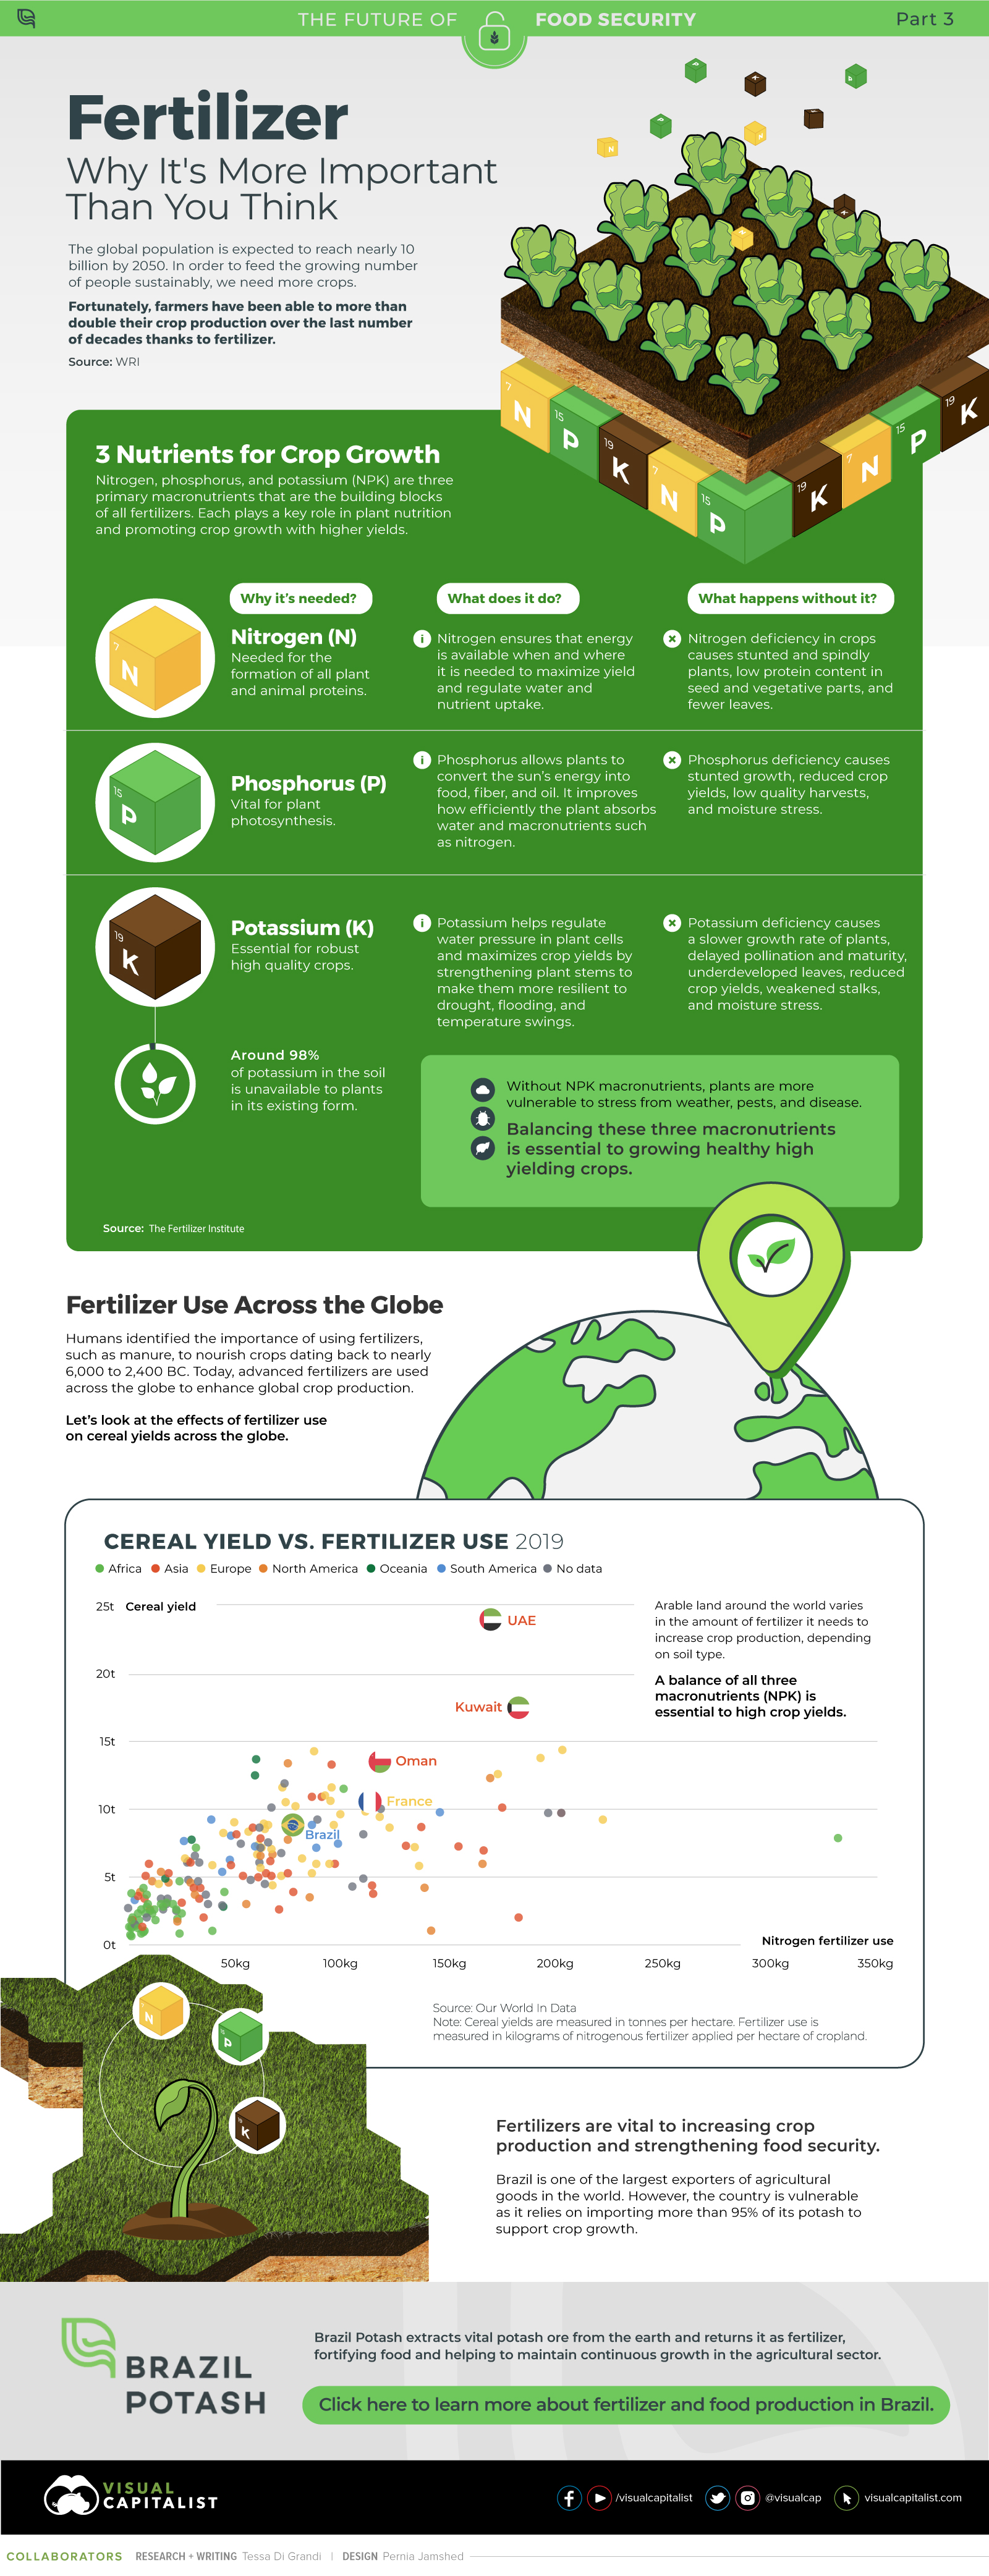
As we explained in Part 2 of our Battery Series, there are still some big obstacles to overcome for green energy, batteries, and energy storage. By looking at all energy use (including non-electrical energy used in automobiles, industrial, etc.), this diagram helps put things in even more perspective. To make a big impact, green energy not only has to make inroads in electrical generation, but it also has to supplant the 25.4 quads of energy being used in the automotive sector. This is why projects like the massive Tesla Gigafactory 1 are such a big deal. If Elon Musk is successful in his mission, the whole diagram and our energy mix would change dramatically. For now, however, green is still a blip on the radar. Looking at total energy consumption in 2015, solar only accounted for 0.53 quads of energy. Meanwhile, wind accounted for 1.82 quads. on Over recent decades, farmers have been able to more than double their production of crops thanks to fertilizers and the vital nutrients they contain. When crops are harvested, the essential nutrients are taken away with them to the dining table, resulting in the depletion of these nutrients in the soil. To replenish these nutrients, fertilizers are needed, and the cycle continues. The above infographic by Brazil Potash shows the role that each macronutrient plays in growing healthy, high-yielding crops.
Food for Growth
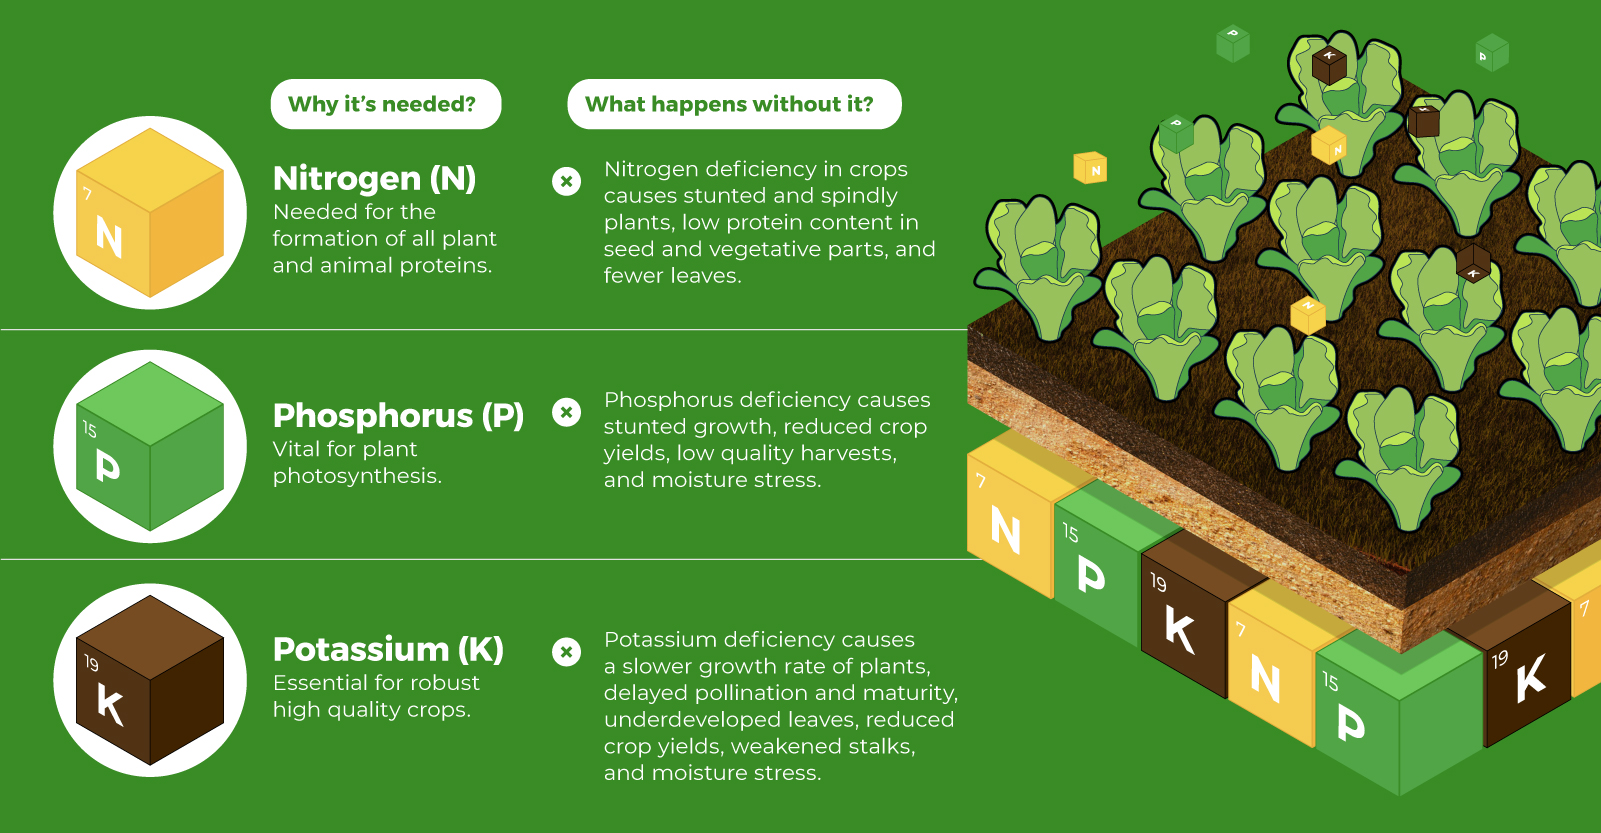
Nitrogen, phosphorus, and potassium (NPK) are three primary macronutrients that are the building blocks of the global fertilizer industry. Each plays a key role in plant nutrition and promoting crop growth with higher yields. Let’s take a look at how each macronutrient affects plant growth. If crops lack NPK macronutrients, they become vulnerable to various stresses caused by weather conditions, pests, and diseases. Therefore, it is crucial to maintain a balance of all three macronutrients for the production of healthy, high-yielding crops.
The Importance of Fertilizers
Humans identified the importance of using fertilizers, such as manure, to nourish crops dating back to nearly 6,000 to 2,400 BC. As agriculture became more intensive and large-scale, farmers began to experiment with different types of fertilizers. Today advanced chemical fertilizers are used across the globe to enhance global crop production. There are a myriad of factors that affect soil type, and so the farmable land must have a healthy balance of all three macronutrients to support high-yielding, healthy crops. Consequently, arable land around the world varies in the amount and type of fertilizer it needs. Fertilizers play an integral role in strengthening food security, and a supply of locally available fertilizer is needed in supporting global food systems in an ever-growing world. Brazil is one of the largest exporters of agricultural goods in the world. However, the country is vulnerable as it relies on importing more than 95% of its potash to support crop growth. Brazil Potash is developing a new potash project in Brazil to ensure a stable domestic source of this nutrient-rich fertilizer critical for global food security. Click here to learn more about fertilizer and food production in Brazil.