Those Cuban cigars are probably not Cubans, the Louis Vuitton bag is a cheap replica, and the Versace sunglasses too cheap to be the real thing. But what if you placed an order for something you thought was truly legitimate, and the fake brand had you fooled? What if this imitation product fell apart in a week, short-circuited, or even caused you direct harm?
Can you Spot a Fake?
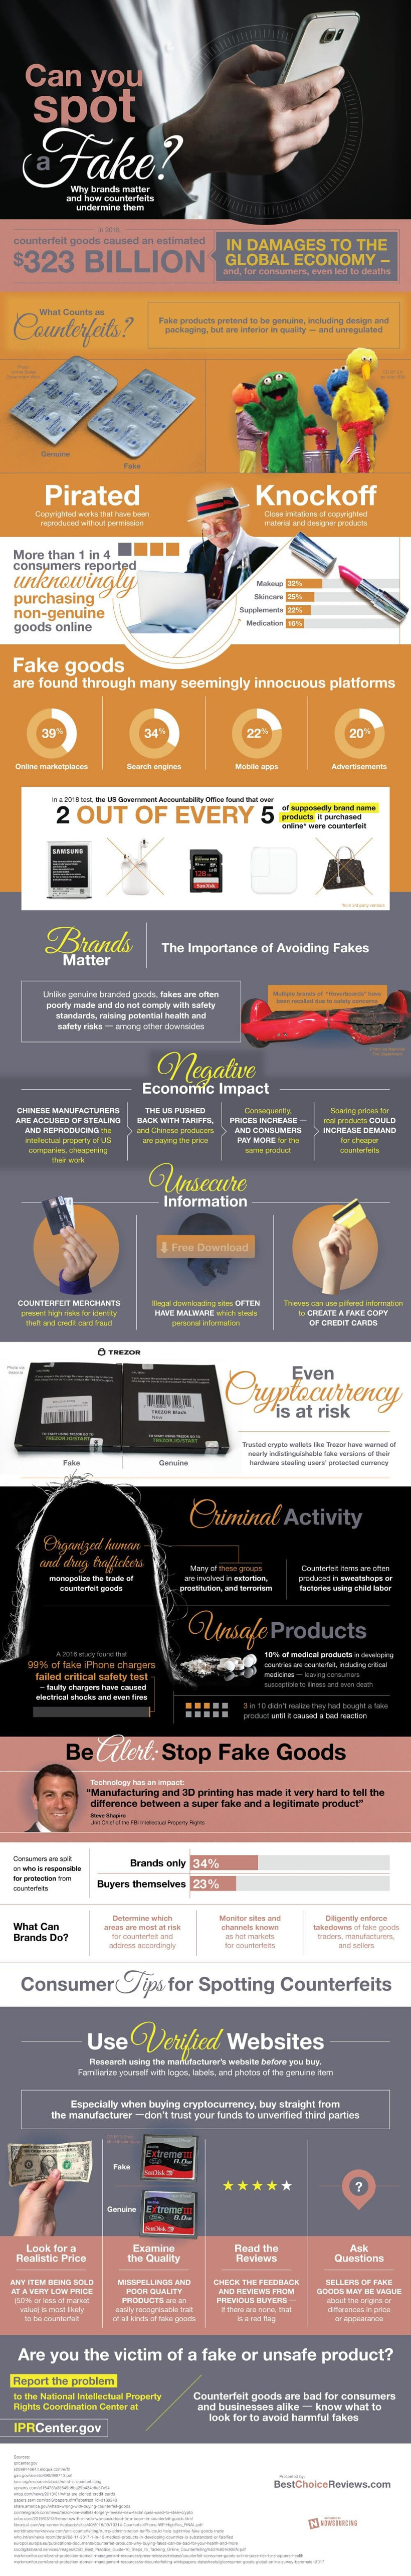
Today’s infographic comes to us from Best Choice Reviews, and it highlights facts and figures around counterfeit goods that are passed off as quality brands, and how this type of activity damages consumers, businesses, and the wider economy.
In 2018, counterfeit goods caused roughly $323 billion of damage to the global economy. These fake products, which pretend to by genuine by using similar design and packaging elements, are not only damaging to the reputations of real brands – they also lead to massive issues for consumers, including the possibility of injury or death.
A Surprisingly Widespread Issue
While it’s easy to downplay the issue of fake goods, it turns out that the data is pretty clear on the subject – and counterfeit goods are finding their way into consumer hands in all sorts of ways. More than 25% of consumers have unwillingly purchased non-genuine goods online – and according to a test by the U.S. Government Accountability Office, it was found that two of every five brand name products they bought online (through 3rd party retailers) were counterfeits. Some of the most common knockoff goods were as follows:
Makeup – 32% Skincare – 25% Supplements – 22% Medication – 16% Aside from the direct impact on consumers and brands themselves, why does this matter? The Importance of Spotting Fakes Outside of the obvious implications, counterfeit activity can open up the door to bigger challenges as well. Economic Impact On a macro scale, the sale of counterfeit goods can snowball into other issues. For example, U.S. accusations of Chinese manufacturers for stealing and reproducing intellectual property has been a major driver of tariff action. Unsecure Information Counterfeit merchants present higher risks for credit card fraud or identity theft, while illegal download sites can host malware that steals personal information Criminal Activity Funds from illicit goods can also be used to help bankroll other illegal activities, such as extortion or terrorism. Unsafe Problems It was found that 99% of all fake iPhone chargers failed to pass critical safety tests – and 10% of medical products are counterfeits in developing countries, which can raise the risk of illness or even death. The issue of fake goods is not only surprisingly widespread in the online era, but the imitation of legitimate brands can also be a catalyst for more serious problems. As a consumer, there are several things you can do to increase the confidence in your purchases, and it all adds up to make a difference.
The Importance of Spotting Fakes
Outside of the obvious implications, counterfeit activity can open up the door to bigger challenges as well. As a consumer, there are several things you can do to increase the confidence in your purchases, and it all adds up to make a difference. on Last year, stock and bond returns tumbled after the Federal Reserve hiked interest rates at the fastest speed in 40 years. It was the first time in decades that both asset classes posted negative annual investment returns in tandem. Over four decades, this has happened 2.4% of the time across any 12-month rolling period. To look at how various stock and bond asset allocations have performed over history—and their broader correlations—the above graphic charts their best, worst, and average returns, using data from Vanguard.
How Has Asset Allocation Impacted Returns?
Based on data between 1926 and 2019, the table below looks at the spectrum of market returns of different asset allocations:
We can see that a portfolio made entirely of stocks returned 10.3% on average, the highest across all asset allocations. Of course, this came with wider return variance, hitting an annual low of -43% and a high of 54%.
A traditional 60/40 portfolio—which has lost its luster in recent years as low interest rates have led to lower bond returns—saw an average historical return of 8.8%. As interest rates have climbed in recent years, this may widen its appeal once again as bond returns may rise.
Meanwhile, a 100% bond portfolio averaged 5.3% in annual returns over the period. Bonds typically serve as a hedge against portfolio losses thanks to their typically negative historical correlation to stocks.
A Closer Look at Historical Correlations
To understand how 2022 was an outlier in terms of asset correlations we can look at the graphic below:
The last time stocks and bonds moved together in a negative direction was in 1969. At the time, inflation was accelerating and the Fed was hiking interest rates to cool rising costs. In fact, historically, when inflation surges, stocks and bonds have often moved in similar directions. Underscoring this divergence is real interest rate volatility. When real interest rates are a driving force in the market, as we have seen in the last year, it hurts both stock and bond returns. This is because higher interest rates can reduce the future cash flows of these investments. Adding another layer is the level of risk appetite among investors. When the economic outlook is uncertain and interest rate volatility is high, investors are more likely to take risk off their portfolios and demand higher returns for taking on higher risk. This can push down equity and bond prices. On the other hand, if the economic outlook is positive, investors may be willing to take on more risk, in turn potentially boosting equity prices.
Current Investment Returns in Context
Today, financial markets are seeing sharp swings as the ripple effects of higher interest rates are sinking in. For investors, historical data provides insight on long-term asset allocation trends. Over the last century, cycles of high interest rates have come and gone. Both equity and bond investment returns have been resilient for investors who stay the course.