Disneyland had a problem though. Only a small fraction of its guests were from the East Coast of the U.S., which meant Disney was missing out on a huge potential audience for his theme park. To expand the company’s reach and scope, he began looking for a location that would match his grand ambitions, and Florida, with its abundance of cheap land and warm climate was a natural choice. On November 22, 1963—coincidentally the day JFK was assassinated—Walt flew over to the Orlando to do some location scouting. At the time, most of the area was swampland, though there was one area adjacent to an under-construction highway that caught his attention. Using shell companies to preserve his anonymity (and to keep the price down), Disney began acquiring the sprawling properties that would become today’s Walt Disney World (WDW).
Walt Disney World: The First Iteration
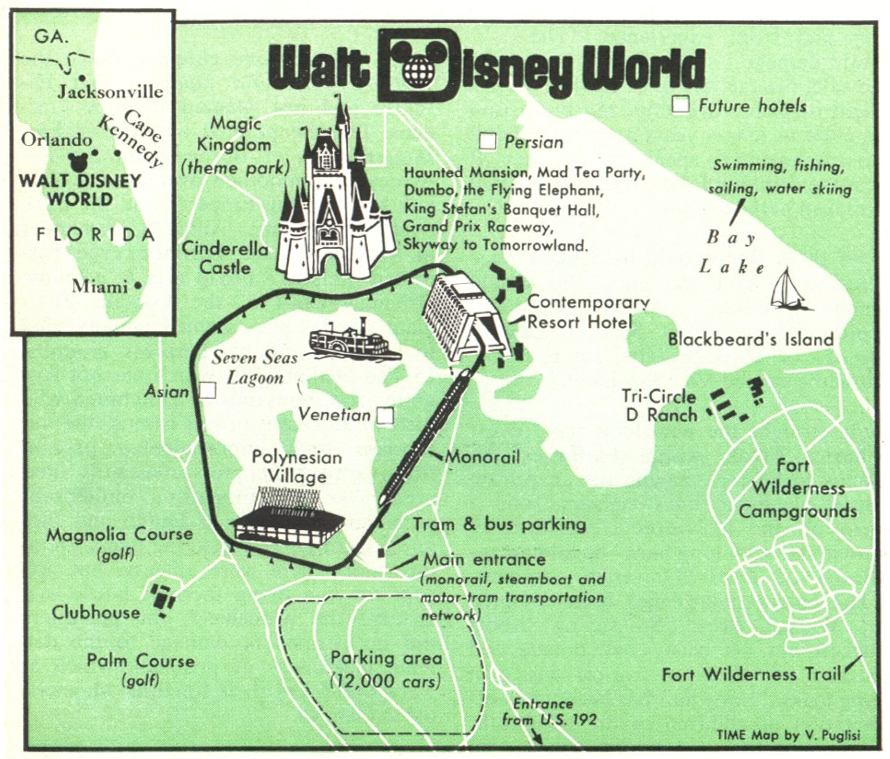
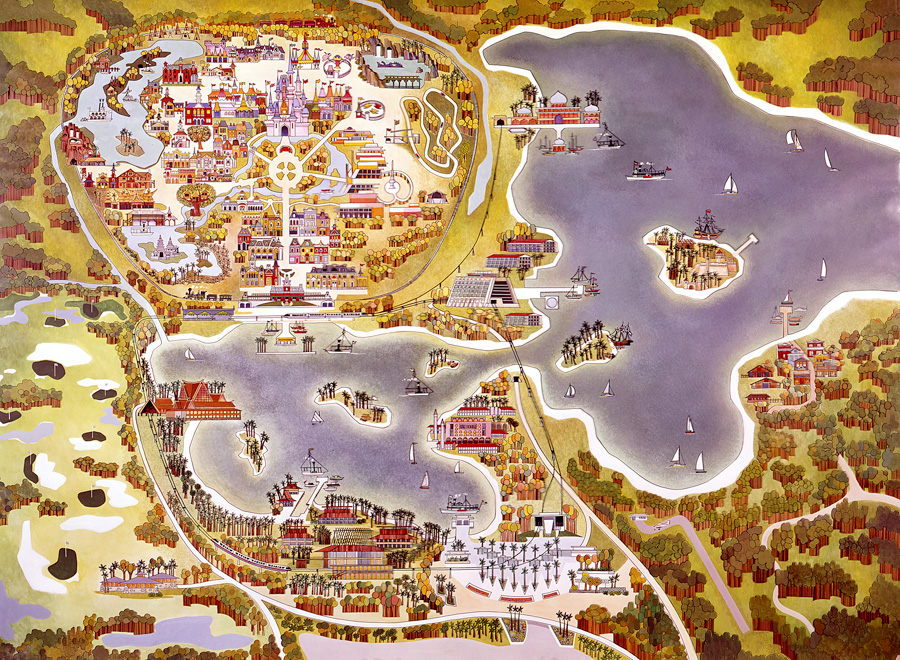
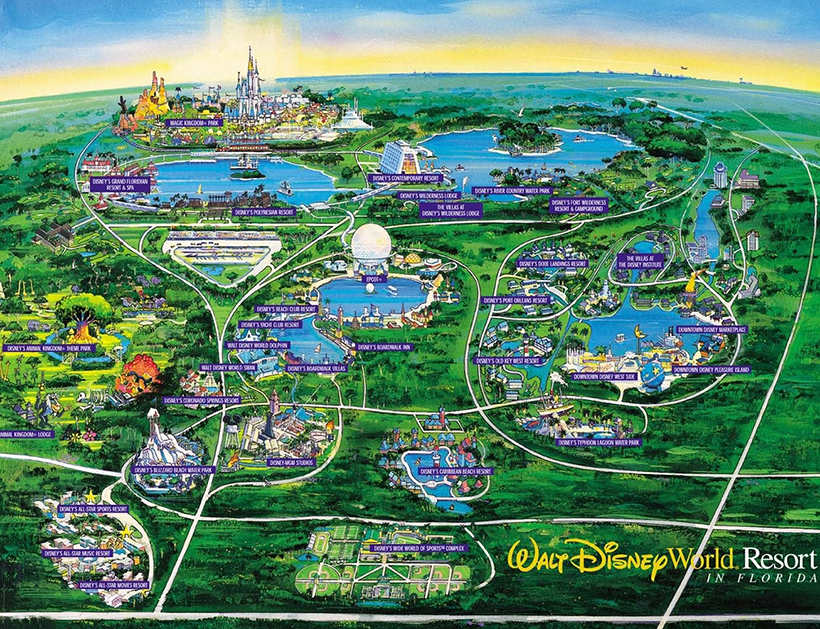
When Walt Disney World finally opened in 1971, it included the main Magic Kingdom site, as well as two golf courses and two hotels—Contemporary Resort and the Polynesian Village Resort. These areas were all connected by a monorail system.
As these maps depict, there was a plan to develop three unique themed zones around the Seven Seas Lagoon: Persian, Asian, and Venetian. However, these projects were scrapped after the 1973 oil crisis as tourism declined.
The original master plan for Walt Disney World did not include plans for the Seven Seas Lagoon, and it was likely added so that the displaced earth could be used to fortify swampy sections of the property to make them suitable for building.
Epcot Expansion
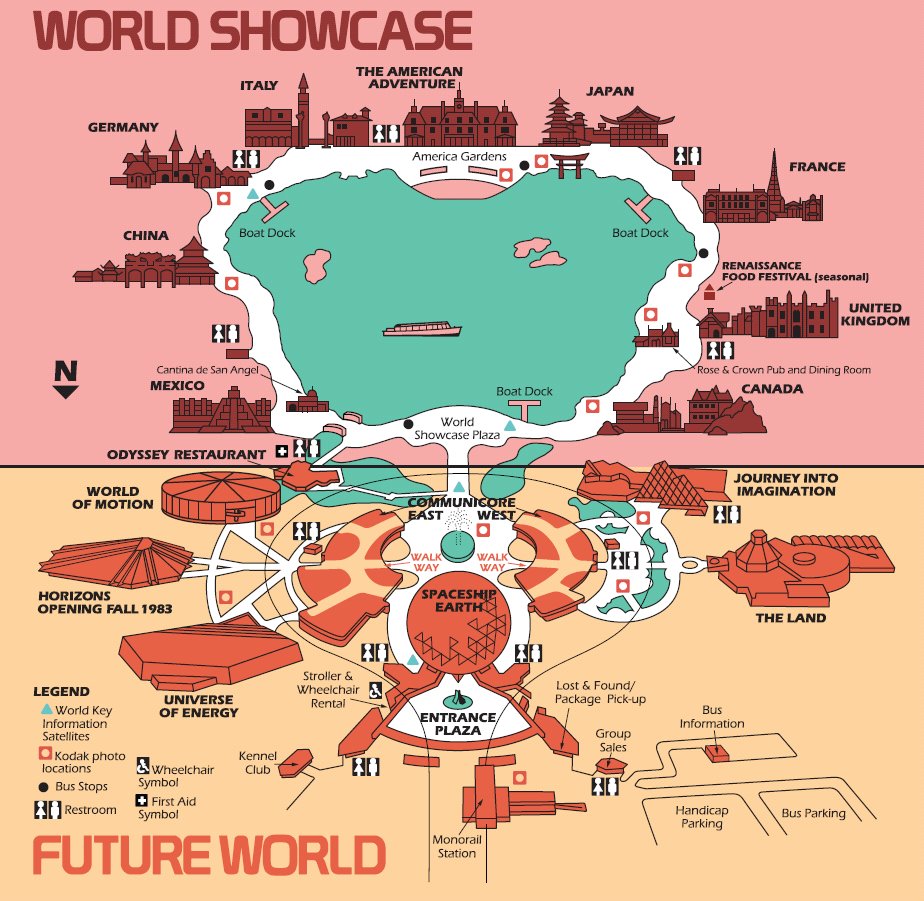
The first major Disney World expansion was Epcot Center, which opened in 1982. The site, which was twice as big as the Magic Kingdom, is best described as a permanent world’s fair. The park was anchored by Future World and “Spaceship Earth”, the iconic geodesic sphere structure that sat at the entrance of the park.
Surrounding the nearby lake were pavilions themed after various locations in the world. Though the scope of Epcot was impressive at the time, it was still vastly scaled down from Walt Disney’s original vision for a fully functioning “city of the future”. Ultimately, the company was uncertain about the feasibility of operating a functional city, so the idea was scrapped in favor of the current iteration.
Hollywood Comes to Florida
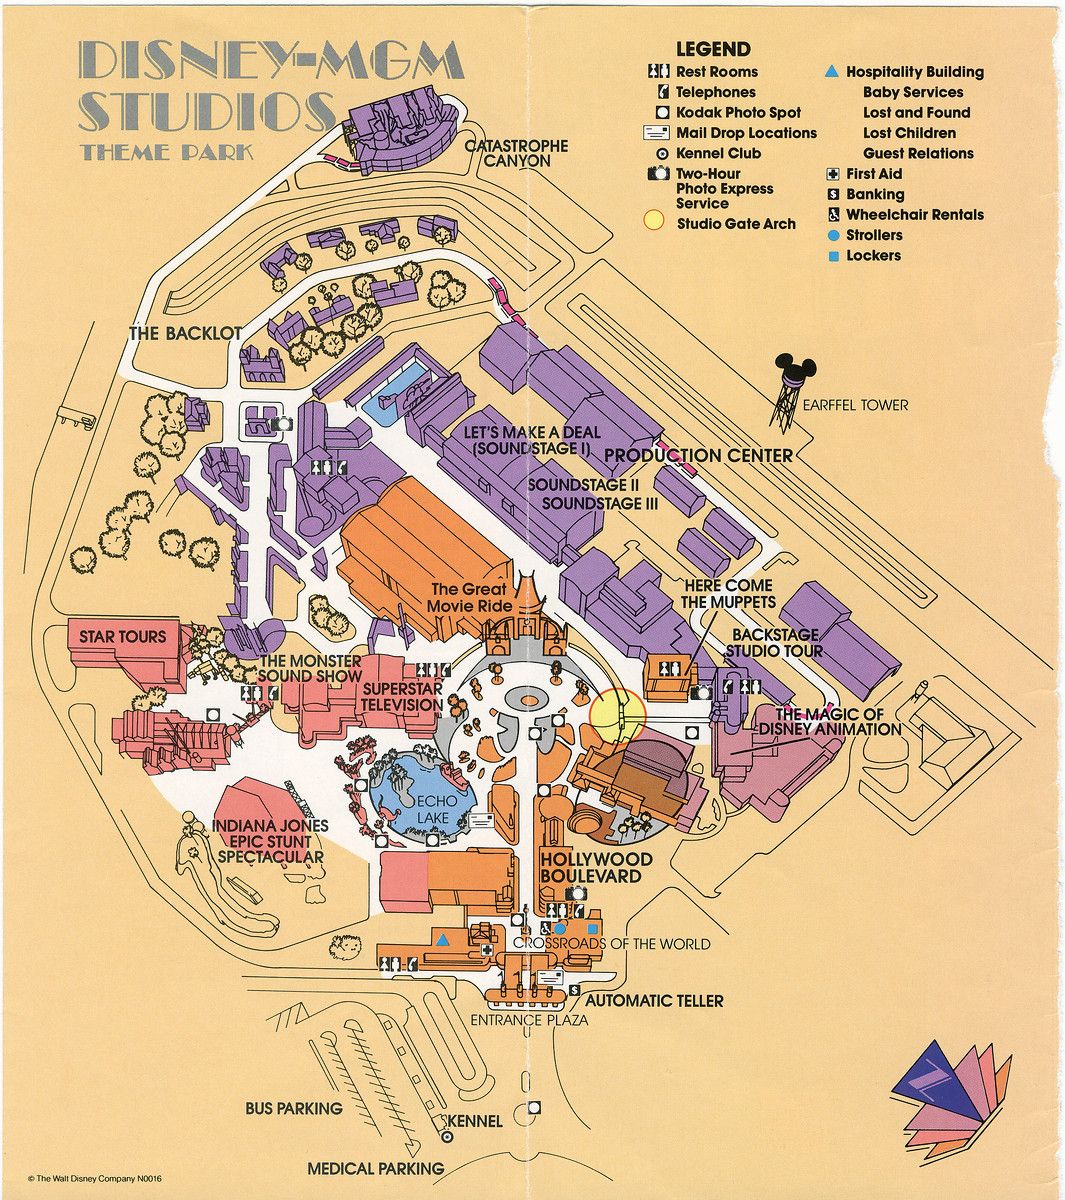
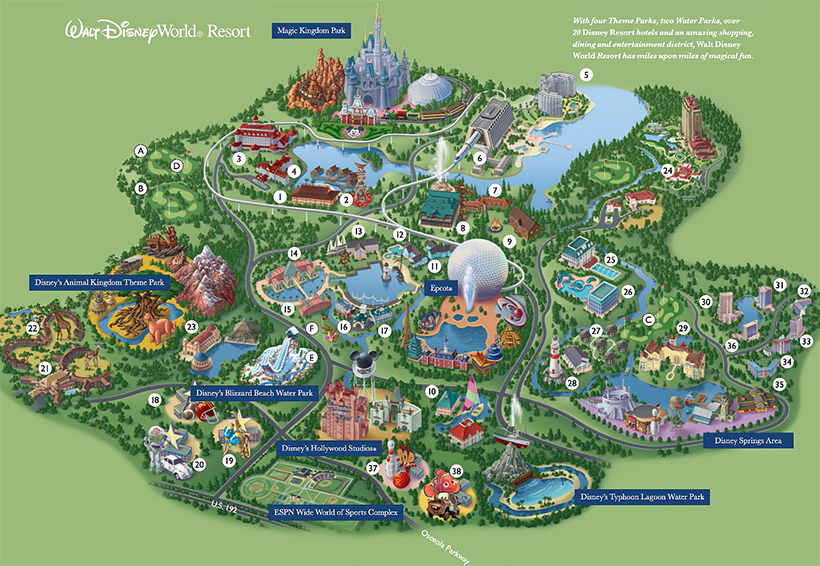
Disney-MGM Studios opened in 1989, in a location just south of Epcot. The park featured “imagined worlds from film, television, music, and theater, drawing inspiration from the Golden Age of Hollywood”. To make this happen, Disney entered into a licensing agreement with MGM to help increase the variety of film representation within the park.
Approximately 11 million visitors pass through Hollywood Studios every year.
Animal Kingdom and Rapid Expansion
In 1998, WDW added a fourth theme park called Animal Kingdom. It’s the largest theme park in the world, covering 580 acres, and combines elements of both a zoo and theme park. A central feature of Animal Kingdom is the massive Tree of Life. The 145 foot tall work of art contains 325 unique animal carvings and over 100,000 artificial leaves. The park itself features about 2,000 animals representing 300 species. Around 13 million people visit the theme park each year.
Walt Disney World Today
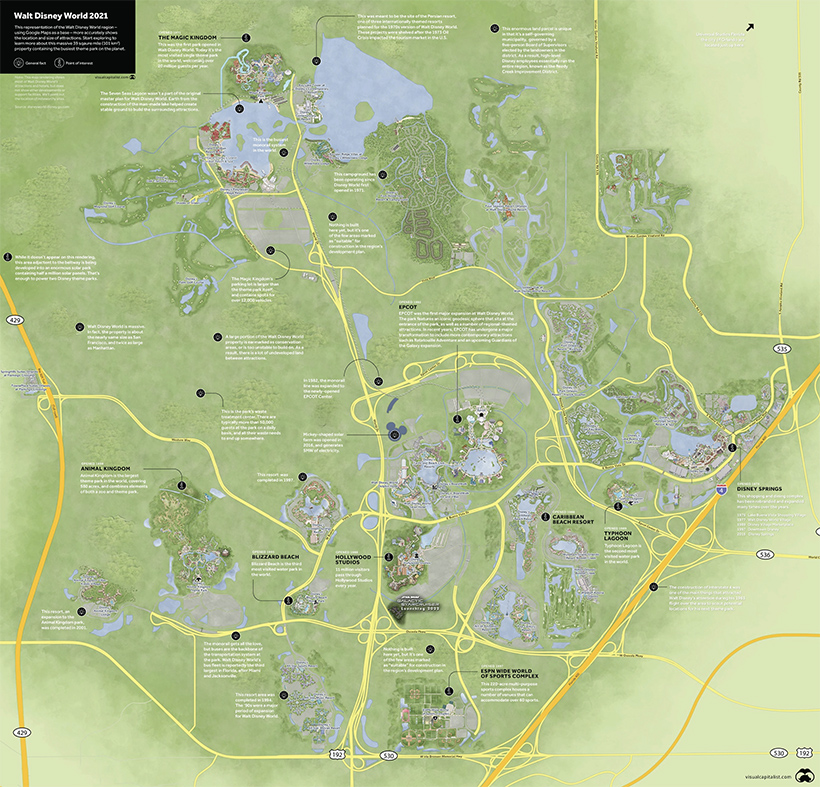
So, how big is Walt Disney World today? 43 square miles, which is about the same area as San Francisco and and twice the size of Manhattan. The scale of today’s WDW has fully eclipsed the original version of the site. The resort, which featured two hotels in 1971, now has more than 20, with 30,000 hotel rooms. WDW is also the largest single site employer in the United States. Looking at the map above, one might wonder whether this sprawling entertainment empire is bursting at the seams. Will WDW eventually build over its entire property? The answer is somewhat complicated.
What’s Missing from Walt Disney World Maps?
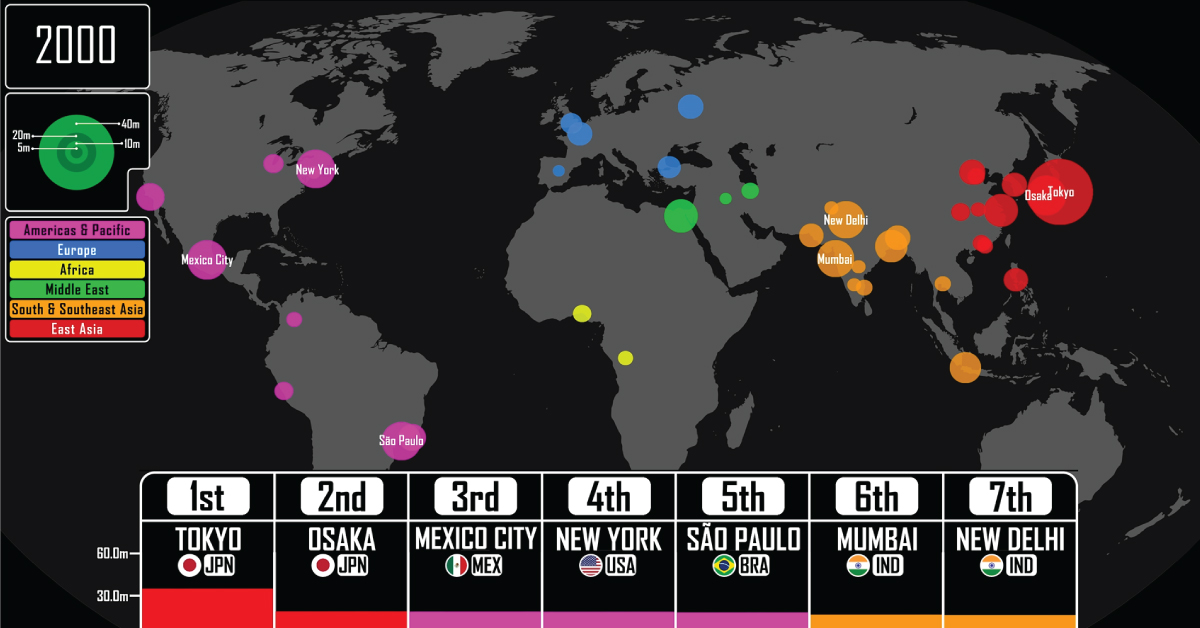
While the stylized maps above do a great job of highlighting WDW’s many attractions, they generally downplay an important fact. Much of the land owned by Disney is still undeveloped, and there is a lot of space between the various parks. Much of this space is earmarked as conservation areas, and only some of the remaining land is actually suitable for development. Despite the sheer size of the property occupied by WDW, space for expansion grows increasingly scarce with each new development. The stylized maps also downplay the size of WDW’s parking lots, which are extensive. The Magic Kingdom parking lot, for example, is actually larger than the theme park itself. The giant map below is an accurate representation of the park’s layout, and includes facts on some of the attributes of the park. This enormous land parcel is also unique in that it’s a kind of self-governing municipality, with its own fire department and emergency services. The district—officially known as the Reedy Creek Improvement District—is governed by a five-person Board of Supervisors elected by the landowners in the district. As a result, high-level Disney employees essentially run the entire region encompassing WDW. In the 50 years since the Magic Kingdom first opened its turnstiles, Disney’s own kingdom in Central Florida has transformed dramatically. With Disney’s continued financial success and the freedom to make large-scale moves within their property, the next 50 years will no doubt bring more dramatic changes to the world’s biggest theme park. on Cities—settlements that are densely populated and self-administered—require many specific prerequisites to come into existence. The most crucial, especially for much of human history, is an abundance of food. Surplus food production leads to denser populations and allows for people to specialize in other skills that are not associated with basic human survival. But that also means that cities usually consume more primary goods than they produce. And their size requires a host of many other services—such as transport and sanitation—that are traditionally expensive to maintain. So maintaining large urban centers, and especially the world’s largest cities, was a monumental task. Mapper and history YouTuber Ollie Bye has visualized the seven largest cities in the world since 3,000 BCE. His video covers cities with a minimum population of 10,000 and hints at historical events which led to the establishment, growth, and eventual fall of cities.
The World’s Largest City Throughout History
With any historical data, accuracy is always a concern, and urban populations were rough and infrequent estimates up until the Industrial Revolution. Bye has used a variety of data sources—including the UN and many research papers—to create the dataset used in the video. In some places he also had to rely on his own estimates and criteria to keep the data reasonable and consistent:
In early history, some cities didn’t have given population estimates for long periods of time, and had to be equalized or estimated through other sources. For example, Babylon had a population estimate at 1,600 BCE (60,000) and at 1,200 BCE (75,000) but none in the 400 years between. Cities that only briefly climbed above a population of 10,000, or that would have made the largest cities ranking for only a couple of years (and based on uncertain estimates), were not included.
Here’s a look at the largest city starting from the year 3,000 BCE, with populations listed in millions during the last year of each city’s “reign.” Cities are also listed with the flags of current-day countries in the same location.
Ancient Cities in the Fertile Crescent
Considered the “cradle of civilization,” the Fertile Crescent in the Middle East was home to all seven of the largest cities in the world in 3,000 BCE. The Sumerian city of Uruk (modern-day Iraq), allegedly home to the legendary king Gilgamesh, topped the list with 40,000 people. It was followed by Memphis (Egypt) with 20,000 inhabitants. For the next 1,700 years, other Mesopotamian cities in modern-day Iraq and Syria held pole positions, growing steadily and shuffling between themselves as the largest. 2,250 BCE marked the first time a different Asian city—Mohenjo-Daro (modern-day Pakistan) from the Indus Valley Civilization—found a spot at #4 with 40,000 people. The table below is a quick snapshot of the seven largest cities in the world for from 3,000 BCE to 200 CE. Again, populations are listed in millions. It wasn’t until 1,250 BCE that the top two spots were taken by cities in different regions: Pi-Ramesses (Egypt) and Yin (China), both with more than 100,000 residents. Egyptian cities would continue to be the most populous for the next millennium—briefly interrupted by Carthage and Babylon—until the start of the Common Era. By 30 CE, Alexandria was the largest city in the world, but the top 10 had representatives from the Middle East, Northern Africa, and Asia.
All Roads Lead to Rome
One city in Europe meanwhile, was also beginning to see steady growth—Rome. It took until halfway through the 3rd century C.E. for Rome to become the most populous city, followed closely still by Alexandria (Egypt). Meanwhile in Iraq, Ctesiphon, the capital of the Sasanian empire was growing rapidly. Towards the end of the 3rd century, the Roman empire was divided into two, with Constantinople becoming the new capital for the Eastern half. Consequently, it had outgrown Rome by 353 and become the world’s most populous city, and for the next few centuries would reclaim this title time and time again.
The Largest Cities Reach 1 Million
In the 9th century, Baghdad became the first city to have 1 million residents (though historians also estimate Rome and the Chinese city of Chang’an may have achieved that figure earlier). It would be nearly nine centuries until a city had one million inhabitants again, and Baghdad’s reign didn’t last long. By the 10th century, Bian, the capital of the Northern Song dynasty in China, had become the largest city in the world, with Baghdad suffering from relocations and shifting political power to other cities in the region. From the 12th century onwards, Mongol invasions in the Middle East and Central Asia severely limited population growth in the region. European cities too were ravaged in the 14th century, but by plagues instead of marauders. For the next few hundred years, Cairo (Egypt), Hangzhou (China), and Vijayanagara (India) would top the list until Beijing took (and mostly held onto) the top spot through the 19th century.
Industrial Revolution and Rapid Urbanization
The start of the Industrial Revolution in the UK—spreading to the rest of Europe and later on the U.S.—led to hitherto unseen levels of urban population growth. Factories needed labor, which caused mass emigration from the rural countryside to urban centers of growth. In 1827, London passed Beijing to become the largest city in the world with 1.3 million residents. Over the next 100 years, its population increased nearly 7 times, remaining the most populous city until the end of World War I, by which time it was overtaken by New York. From 1920 to 2022, the world population quadrupled thanks to improvements in farming and healthcare, and cities saw rapid growth as well. The beginning of the 20st century saw the top 10 largest cities in the world in the U.S., Europe, and Japan. By the 21st century however, growth shifted away to other parts of the world and by 2021, the top seven had cities only from Asia and the Americas. Tokyo, which took the top spot in 1954, is the largest city in the world today with a population of 37 million (including the entire metropolitan area). It is followed by New Delhi with 31 million, but by 2028, the UN estimates that positions will switch on the leaderboard and New Delhi will overtake Tokyo.
What Does Population Growth Say About the Past (and Future)?
The rise and fall of cities through the sands of time can give us insight into the trajectory of civilization growth. As civilizations grow, become richer, and reach their zenith, so too do their cities blossom in tandem. For example, of the modern-day seven largest cities in the world, four of them belong to countries with the 10 largest economies in the world. Meanwhile, sudden falls in urban population point to turbulence—political instability, wars, natural disasters, or disease. Most recently Ukraine’s cities are seeing depopulation as residents flee conflict zones, raising the specter of a demographic crisis for the country should the war continue. Thus, tracking the size of urban population can help policymakers forecast future roadblocks to growth, especially when prioritizing sustainable growth for a country.