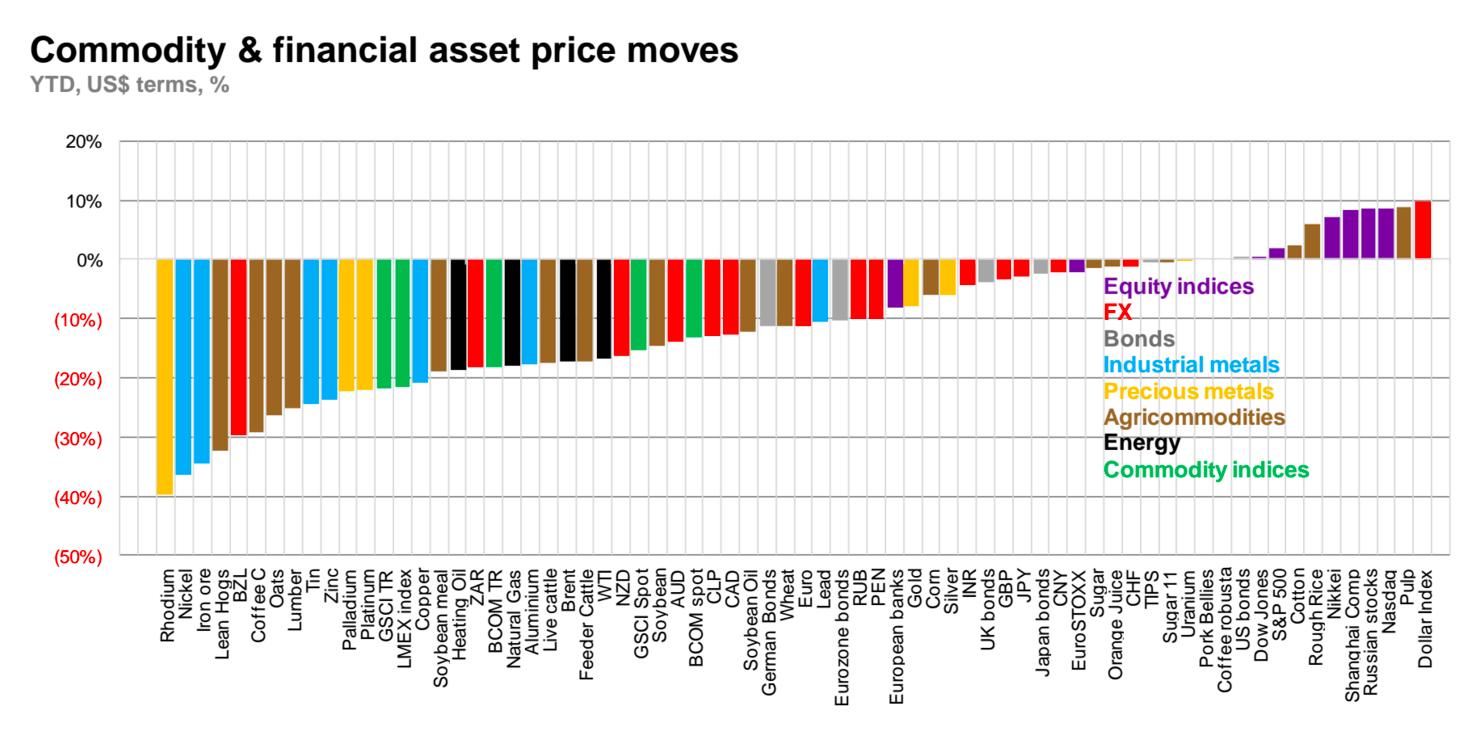
The Collapse of Commodities in One Simple Chart
This chart from Macquarie puts the year in perspective for commodity investors. It covers various asset classes including equities, FX markets, bonds, and commodity prices, and charts them YTD in terms of US dollars and expressed as a percentage. For a simple chart, there is a lot of information here to consider. For starters, on the far right is the prime culprit in stymying commodity markets: the Dollar Index. The US dollar, which commodities are priced in, has had a big year with close to a 10% return YTD. While the US economy is still suspect at best, it has served as a safe haven for investors this year over markets such as Europe, China, and Japan. As a result, the USD has had the best performance of all of these asset classes listed on the chart. To the left of the zero mark, things get dire fast. Precious metals such as gold and silver are down, but this can be mostly attributed to the strength of the dollar. Energy and industrial metals, on the other hand, have been thoroughly routed due to a combination of dollar strength and slowing Chinese growth. Many agricommodities have struggled as well. The biggest losers of the bunch include rhodium, nickel, iron ore, and lean hogs, all which are down more than 30% YTD.
on
#1: High Reliability
Nuclear power plants run 24/7 and are the most reliable source of sustainable energy. Nuclear electricity generation remains steady around the clock throughout the day, week, and year. Meanwhile, daily solar generation peaks in the afternoon when electricity demand is usually lower, and wind generation depends on wind speeds.As the use of variable solar and wind power increases globally, nuclear offers a stable and reliable backbone for a clean electricity grid.
#2: Clean Electricity
Nuclear reactors use fission to generate electricity without any greenhouse gas (GHG) emissions.Consequently, nuclear power is the cleanest energy source on a lifecycle basis, measured in CO2-equivalent emissions per gigawatt-hour (GWh) of electricity produced by a power plant over its lifetime. The lifecycle emissions from a typical nuclear power plant are 273 times lower than coal and 163 times lower than natural gas. Furthermore, nuclear is relatively less resource-intensive, allowing for lower supply chain emissions than wind and solar plants.
#3: Stable Affordability
Although nuclear plants can be expensive to build, they are cost-competitive in the long run. Most nuclear plants have an initial lifetime of around 40 years, after which they can continue operating with approved lifetime extensions. Nuclear plants with lifetime extensions are the cheapest sources of electricity in the United States, and 88 of the country’s 92 reactors have received approvals for 20-year extensions. Additionally, according to the World Nuclear Association, nuclear plants are relatively less susceptible to fuel price volatility than natural gas plants, allowing for stable costs of electricity generation.
#4: Energy Efficiency
Nuclear’s high energy return on investment (EROI) exemplifies its exceptional efficiency. EROI measures how many units of energy are returned for every unit invested in building and running a power plant, over its lifetime. According to a 2018 study by Weissbach et al., nuclear’s EROI is 75 units, making it the most efficient energy source by some distance, with hydropower ranking second at 35 units.
#5: Sustainable Innovation
New, advanced reactor designs are bypassing many of the difficulties faced by traditional nuclear plants, making nuclear power more accessible.
Small Modular Reactors (SMRs) are much smaller than conventional reactors and are modular—meaning that their components can be transported and assembled in different locations. Microreactors are smaller than SMRs and are designed to provide electricity in remote and small market areas. They can also serve as backup power sources during emergencies.
These reactor designs offer several advantages, including lower initial capital costs, portability, and increased scalability.
A Nuclear-Powered Future
Nuclear power is making a remarkable comeback as countries work to achieve climate goals and ultimately, a state of energy utopia. Besides the 423 reactors in operation worldwide, another 56 reactors are under construction, and at least 69 more are planned for construction. Some nations, like Japan, have also reversed their attitudes toward nuclear power, embracing it as a clean and reliable energy source for the future. CanAlaska is a leading exploration company in the Athabasca Basin, the Earth’s richest uranium depository. Click here to learn more now. In part 3 of the Road to Energy Utopia series, we explore the unique properties of uranium, the fuel that powers nuclear reactors.