Like any other market, there are many opinions on what a currency ought to be worth relative to others. With certain currencies, that spectrum of opinions is fairly narrow. As an example, for the world’s most traded currency – the U.S. dollar – the majority of opinions currently fall in a range from the dollar being 2% to 11% overvalued, according to organizations such as the Council of Foreign Relations, the Bank of International Settlements, the OECD, and the IMF. For other currencies, the spectrum is much wider. The Swiss franc, which some have called the world’s most perplexing currency, has estimates from those same groups ranging from about 13% undervalued to 21% overvalued. Such a variance in estimates makes it hard to come up with any conclusive consensus – so in today’s chart, we refer to a more caffeinated and fun measure that also approximates the relative value of currencies.
The Impartial Bean
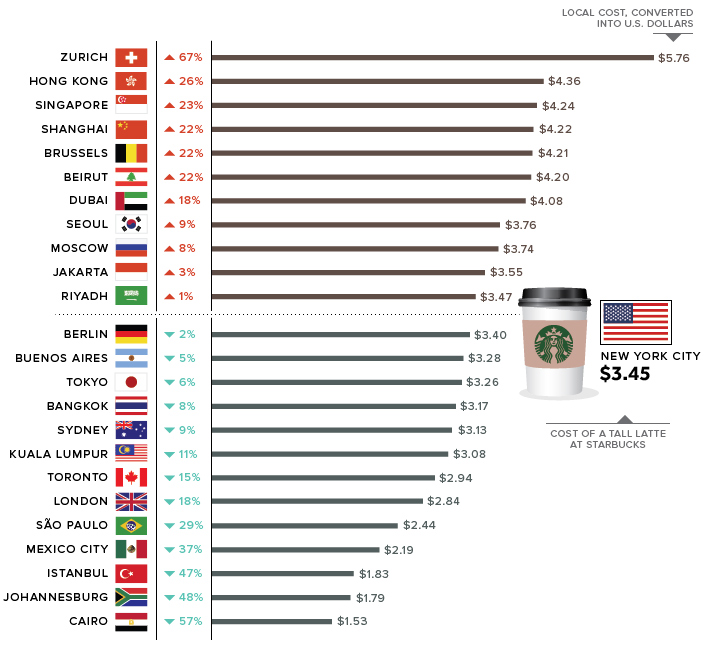
The “Latte Index”, developed by The Wall Street Journal, uses purchasing-power parity (PPP) – comparing the cost of the same good in different countries – to estimate which currencies are overvalued and undervalued. In this case, the WSJ tracked down the price of a tall Starbucks latte in dozens of cities around the world. These prices are then converted to U.S. dollars and compared to the benchmark price, which is a tall Starbucks latte in New York City (US$3.45).
The Latte Index is mostly for fun, but it’s also broadly in line with predictions made by the experts. For example, the price of a latte in Toronto, Canada works out to US$2.94, which is about 14.8% under the benchmark NYC price. This suggests that relative to the USD, the Canadian dollar is undervalued. Interestingly, estimates from the aforementioned sources (BIS, OECD, CFR, IMF) have the Canadian dollar at being up to 10% undervalued – which puts the Latte Index not too far off. Given the wild range of estimates that exist for currency values, using the relative cost of a cup of joe might be as good of a proxy as any. on Last year, stock and bond returns tumbled after the Federal Reserve hiked interest rates at the fastest speed in 40 years. It was the first time in decades that both asset classes posted negative annual investment returns in tandem. Over four decades, this has happened 2.4% of the time across any 12-month rolling period. To look at how various stock and bond asset allocations have performed over history—and their broader correlations—the above graphic charts their best, worst, and average returns, using data from Vanguard.
How Has Asset Allocation Impacted Returns?
Based on data between 1926 and 2019, the table below looks at the spectrum of market returns of different asset allocations:
We can see that a portfolio made entirely of stocks returned 10.3% on average, the highest across all asset allocations. Of course, this came with wider return variance, hitting an annual low of -43% and a high of 54%.
A traditional 60/40 portfolio—which has lost its luster in recent years as low interest rates have led to lower bond returns—saw an average historical return of 8.8%. As interest rates have climbed in recent years, this may widen its appeal once again as bond returns may rise.
Meanwhile, a 100% bond portfolio averaged 5.3% in annual returns over the period. Bonds typically serve as a hedge against portfolio losses thanks to their typically negative historical correlation to stocks.
A Closer Look at Historical Correlations
To understand how 2022 was an outlier in terms of asset correlations we can look at the graphic below:
The last time stocks and bonds moved together in a negative direction was in 1969. At the time, inflation was accelerating and the Fed was hiking interest rates to cool rising costs. In fact, historically, when inflation surges, stocks and bonds have often moved in similar directions. Underscoring this divergence is real interest rate volatility. When real interest rates are a driving force in the market, as we have seen in the last year, it hurts both stock and bond returns. This is because higher interest rates can reduce the future cash flows of these investments. Adding another layer is the level of risk appetite among investors. When the economic outlook is uncertain and interest rate volatility is high, investors are more likely to take risk off their portfolios and demand higher returns for taking on higher risk. This can push down equity and bond prices. On the other hand, if the economic outlook is positive, investors may be willing to take on more risk, in turn potentially boosting equity prices.
Current Investment Returns in Context
Today, financial markets are seeing sharp swings as the ripple effects of higher interest rates are sinking in. For investors, historical data provides insight on long-term asset allocation trends. Over the last century, cycles of high interest rates have come and gone. Both equity and bond investment returns have been resilient for investors who stay the course.