By looking back at previous years, investors can gain insights into long-term trends and patterns in commodity prices. To help better understand these trends, U.S. Global Investors releases a visualization called the Periodic Table of Commodity Returns at the outset of each year. This year’s edition looks back over the past decade of returns between 2013 and 2022, and features an interactive design that allows users to sort returns by various categories including returns, volatility, and other groupings. Editor’s note: Because of the Russia-Ukraine conflict, regional benchmarks for some commodities (coal, natural gas) had much bigger price divergences than is typical. In this case the graphic focuses in on U.S. regional benchmarks like Powder River Basin coal and Henry Hub natural gas prices. These prices may differ from price action seen around the world.
More Volatility, but Positive Returns
After 2021 saw an impressive surge in commodity prices as the world reopened post-pandemic, 2022 brought another year of positive returns for the asset class that were defined by high levels of volatility. The broad-based S&P Goldman Sachs Commodity Index (GSCI) surged 52.1% in the first five months of 2022, as supply disruptions and fears across grains, metals, and energy fuels were spurred by Russia’s invasion of Ukraine. The second half of the year saw prices cool as the U.S. continued to release crude oil from its strategic petroleum reserve while Russia and Ukraine established an agreement to enable grain and agricultural exports, quelling fears of extended supply disruptions. The result? In the last seven months of the year the S&P GSCI nearly completed a return trip and only ended up rising 8.7% in 2022 overall. Another key factor that helped keep commodity prices cool in 2022 was China’s extended lockdowns which slowed down the country’s manufacturing and industrial capabilities. This helped reduce the demand of energy fuels in 2022, along with industrial metals like copper, aluminum, and zinc.
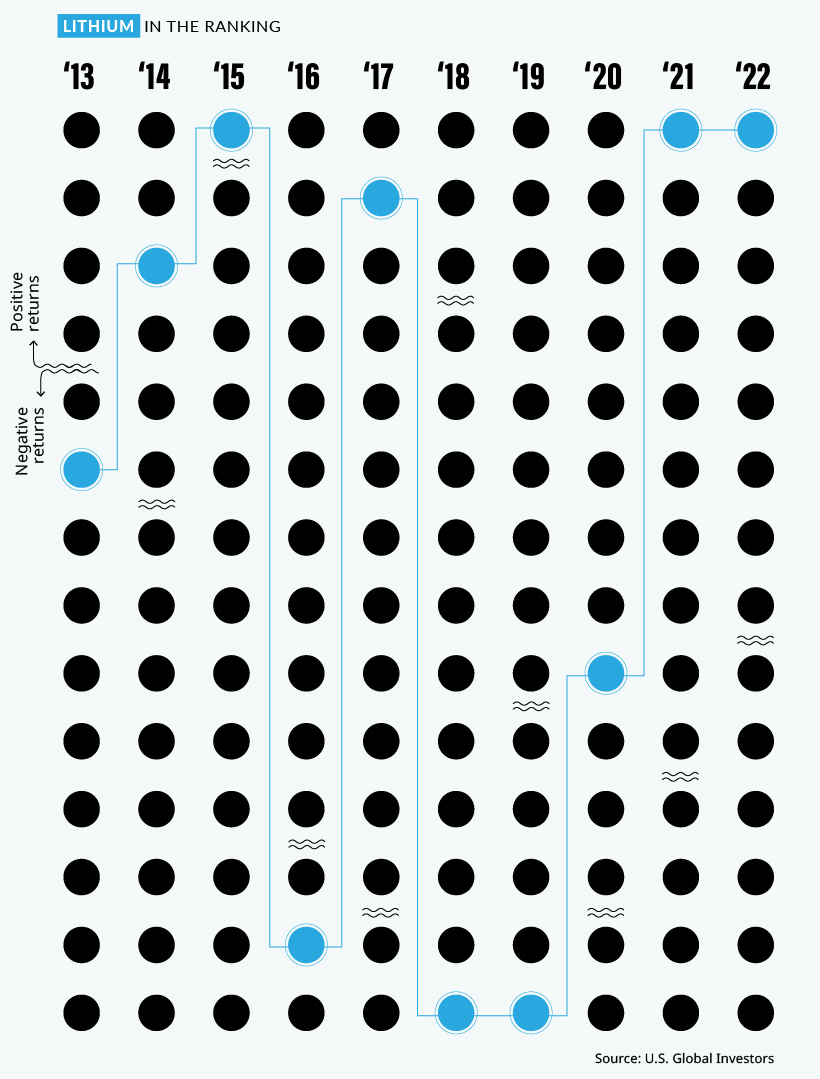
Lithium Continues to Top Commodity Returns
A metal that did shine brightly in 2022 was lithium, which has been newly added to the Periodic Table of Commodity Returns. After topping the table in 2021 with an outsized price increase of 442.8%, lithium kept its top spot in 2022 with a more modest price increase of 72.5%.
The growing global push towards electric vehicles (EVs) has been a major contributor to the increase in demand for lithium and nickel, which was the second-best performing commodity in 2022 with a price increase of 43.1%. As more countries set targets to phase out gasoline and diesel vehicles, demand for key battery minerals like lithium and nickel is expected to continue to rise. While the U.S. is working to strengthen its battery metals production and supply chains with $2.8 billion in grants for domestic lithium, graphite, and nickel projects, it will be years before more supply comes online as a result. In the meantime, robust demand for EVs in China has provided a constant need for these battery metals which are currently in short supply.
Energy Price Variance Fueled by Regional Uncertainty
After 2021 saw energy fuels dominate the top spots after lithium, energy fuel prices in 2022 were more volatile with more scattered returns. Natural gas was the only fuel which saw double-digit returns at a 19.9%, with crude oil returning 6.7% and coal at the bottom of the table at -48.3%. It’s important to keep in mind how geopolitical events and supply disruptions last year affected the regional price differences for energy fuels. While WTI crude oil (North America’s benchmark) increased by 6.7% in 2022, Brent crude oil (Europe’s benchmark) was up 10.4% as Urals crude oil (Russia’s benchmark) fell by more than 26.5%. As a result of the war and ensuing sanctions, the discount of Urals crude oil compared to Brent crude oil went from -$1.72 at the start of 2022 all the way to -$30.71 by the end of the year. Thermal coal prices faced similar regional divergences, with Powder River Basin (PRB) coal (America’s benchmark for coal) falling by 48.3% this year while Newcastle coal, which is delivered out of the port of Newcastle, Australia primarily to various Asian nations, saw prices skyrocket up by 156.6% in 2022. After such a wild year with huge variance in commodity prices, we’ll see if 2023 can bring some stability or if high volatility and growing regional price discrepancies will become the norm. on These faulty airbags, installed by 19 different automakers including BMW and Toyota from 2002 to 2015, can explode when deployed and have led to numerous tragic accidents. Their recall affected 67 million airbags (including Honda’s vehicles above) and has been known as the largest safety recall in U.S. history. Over the past four decades, there have been over 22,000 automobile recalls in the United States. In this interactive piece, Chimdi Nwosu uses data from the National Highway Traffic Safety Administration to visualize the types of automobile recalls over the past 40 years, the companies with the most recalls, the components that were recalled the most, and, most importantly, their impacts on people.
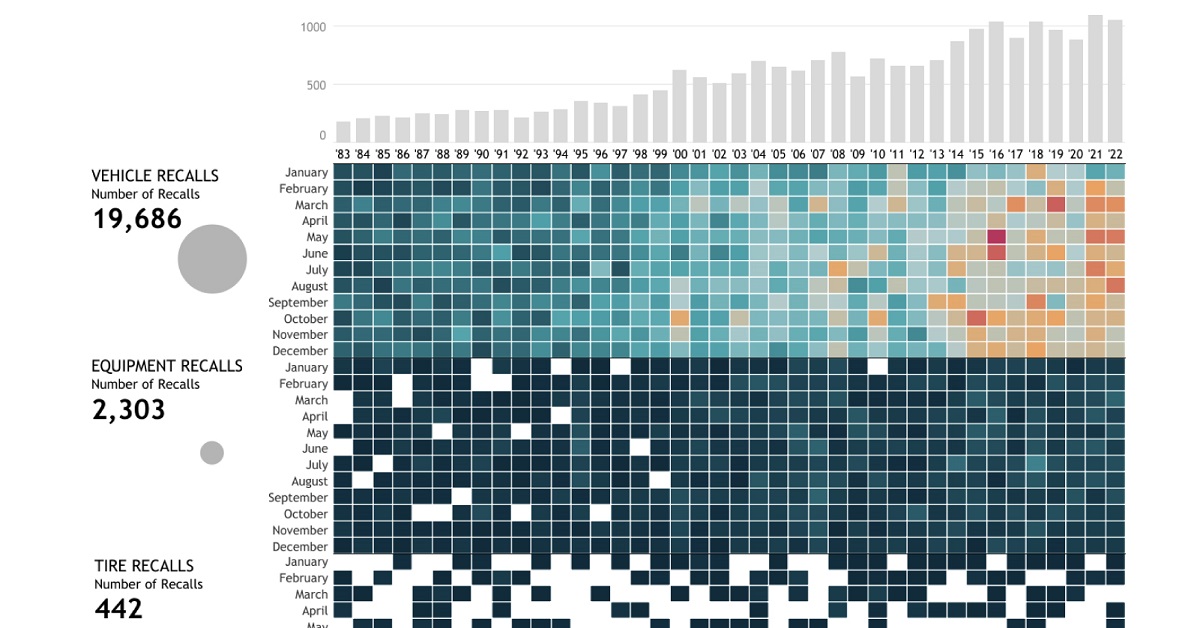
Breaking Down U.S. Automobile Recalls
Whether a recall affects specific vehicle components, equipment, or vehicles as a whole, it affects the lives of millions of automobile users. When combined, these numbers ramp up exponentially. The U.S. alone has seen a total of 22,651 recalls over the past 40 years, impacting more than one billion people. Almost 72% of these people were affected by nearly 20,000 vehicle recalls, while around 19% were impacted by over 2,000 equipment recalls during this period. Comparatively, the 442 tire recalls and 220 child seat recalls affected significantly less, but still a total of 96.9 million people. While an inconvenience to many, the recall of these faulty vehicle parts saves many more from unfortunate incidents that may have occurred if left unchecked.
Minor and Major Recalls
One of the largest recalls in history took place in 2014 when General Motors—the manufacturer with the highest total of recalls in four decades—recalled millions of vehicles including the 2005-2007 Chevrolet Cobalt, 2007 Pontiac G5, and 2006-2007 Chevrolet HHR, amongst others. The reason for this recall was a faulty ignition switch that caused the vehicle’s engine to shut down while driving, disabling safety systems including airbags. This fault led to the death of hundreds of people. However, not all recalls are this severe. BMW, for example, recalled just four vehicles in December last year because one of the four bolts in the driver’s backrest was not attached properly. Similarly in 2020, Ford recalled some of its vehicles due to a faulty door latch. While this recall inconvenienced over two million users, it was less likely to lead to severe consequences if left unchecked.
A Safer Future?
The number of automobile recalls over the past four decades has seen a steep rise. As have car safety standards. While recalls could hint at the risks involved in taking your car out for a drive, they also indicate manufacturers taking responsibility for their faulty commodities, and affect a very small percentage of vehicles on the road. To improve automobile safety, the NHTSA proposed a New Car Assessment Program in 2022, which provides vehicle users with safety ratings for every new vehicle. This five-star safety rating program rates the vehicles’ safety features, crashworthiness, and resistance to rollover. With self-driving cars now also entering the mix, we need to stay informed about vehicle safety to keep our vehicles, our streets, and ourselves safe in the future.