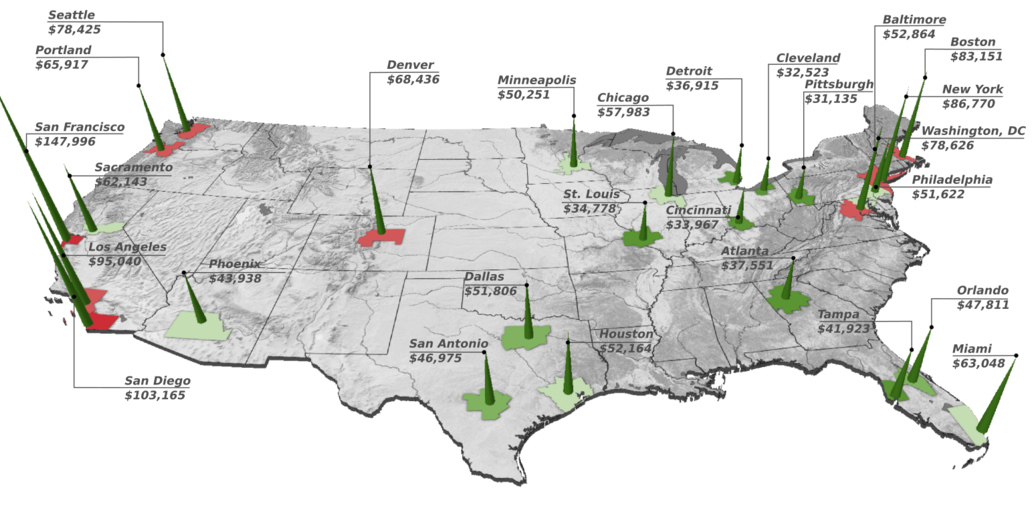
Most U.S. housing markets peaked sometime in 2006, and it wouldn’t be until just before the third-round of quantitative easing in 2012 that this fall would finally be cushioned. Since then, the combination of QE and record-low interest rates have helped re-inflate the housing market. For better or worse, real estate in many U.S. cities are now approaching or passing their 2006 housing highs, but with a growing disparity between individual metropolitan areas. Today’s 3D map comes to us from HowMuch.net, and it shows the very different salaries needed to buy a median home in 27 different U.S. metropolitan areas. The salaries range between $31,134 to $147,996, which is a discrepancy of over $100,000. At the low end of the spectrum, it takes a salary of between $30,000 to $40,000 to buy a home in most metropolitan areas in the Midwest. In St. Louis, for example, the salary needed to buy a home is $34,778. Pittsburgh was the least expensive city analyzed, where a salary of $31,135 could buy the median house in the city. At the high end is any metropolitan area in California, for which closer to six figures is now needed. San Francisco has the most expensive housing in the country, where residents must make $147,996 a year to be an average homeowner. However, Southern California is not far behind the Bay Area, where salaries of $95,040 and $103,165 are required to buy in Los Angeles and San Diego respectively. See the full data set, including mortgage rates, monthly payments, and median house prices here.
West Coast Envy
Which cities have rebounded the most since the popping of the housing bubble? According to The Economist’s interactive chart on U.S. housing price indices, the average U.S. market recovery between 2006 peak and 2012 trough has been about 63.9%. The Eastern half of the country has struggled to rebound to 2006 housing highs, with New York City, Baltimore, Philadelphia, Chicago, Tampa, Miami, and St. Louis all recovering below the above average mark. In contrast, prices in the West are soaring: San Francisco, Houston, Dallas, Denver, and Portland have all met or exceeded their 2006 highs. Meanwhile, Los Angeles, Seattle, and San Diego have recovered better than average.
on The good news is that the Federal Reserve, U.S. Treasury, and Federal Deposit Insurance Corporation are taking action to restore confidence and take the appropriate measures to help provide stability in the market. With this in mind, the above infographic from New York Life Investments looks at the factors that impact bonds, how different types of bonds have historically performed across market environments, and the current bond market volatility in a broader context.
Bond Market Returns
Bonds had a historic year in 2022, posting one of the worst returns ever recorded. As interest rates rose at the fastest pace in 40 years, it pushed bond prices lower due to their inverse relationship. In a rare year, bonds dropped 13%.
Source: FactSet, 01/02/2023.
Bond prices are only one part of a bond’s total return—the other looks at the income a bond provides. As interest rates have increased in the last year, it has driven higher bond yields in 2023.
Source: YCharts, 3/20/2023.
With this recent performance in mind, let’s look at some other key factors that impact the bond market.
Factors Impacting Bond Markets
Interest rates play a central role in bond market dynamics. This is because they affect a bond’s price. When rates are rising, existing bonds with lower rates are less valuable and prices decline. When rates are dropping, existing bonds with higher rates are more valuable and their prices rise. In March, the Federal Reserve raised rates 25 basis points to fall within the 4.75%-5.00% range, a level not seen since September 2007. Here are projections for where the federal funds rate is headed in 2023:
Federal Reserve Projection*: 5.1% Economist Projections**: 5.3%
*Based on median estimates in the March summary of quarterly economic projections.**Projections based on March 10-15 Bloomberg economist survey. Together, interest rates and the macroenvironment can have a positive or negative effect on bonds.
Positive
Here are three variables that may affect bond prices in a positive direction:
Lower Inflation: Reduces likelihood of interest rate hikes. Lower Interest Rates: When rates are falling, bond prices are typically higher. Recession: Can prompt a cut in interest rates, boosting bond prices.
Negative
On the other hand, here are variables that may negatively impact bond prices:
Higher Inflation: Can increase the likelihood of the Federal Reserve to raise interest rates. Rising Interest Rates: Interest rate hikes lead bond prices to fall. Weaker Fundamentals: When a bond’s credit risk gets worse, its price can drop. Credit risk indicates the chance of a default, the risk of a bond issuer not making interest payments within a given time period.
Bonds have been impacted by these negative factors since inflation started rising in March 2021.
Fixed Income Opportunities
Below, we show the types of bonds that have had the best performance during rising rates and recessions.
Source: Derek Horstmeyer, George Mason University 12/3/2022. As we can see, U.S. ultrashort bonds performed the best during rising rates. Mortgage bonds outperformed during recessions, averaging 11.4% returns, but with higher volatility. U.S. long-term bonds had 7.7% average returns, the best across all market conditions. In fact, they were also a close second during recessions. When rates are rising, ultrashort bonds allow investors to capture higher rates when they mature, often with lower historical volatility.
A Closer Look at Bond Market Volatility
While bond market volatility has jumped this year, current dislocations may provide investment opportunities. Bond dislocations allow investors to buy at lower prices, factoring in that the fundamental quality of the bond remains strong. With this in mind, here are two areas of the bond market that may provide opportunities for investors:
Investment-Grade Corporate Bonds: Higher credit quality makes them potentially less vulnerable to increasing interest rates. Intermediate Bonds (2-10 Years): Allow investors to lock in higher rates.
Both types of bonds focus on quality and capturing higher yields when faced with challenging market conditions.
Finding the Upside
Much of the volatility seen in the banking sector was due to banks buying bonds during the pandemic—or even earlier—at a time when interest rates were historically low. Since then, rates have climbed considerably. Should rates moderate or stop increasing, this may present better market conditions for bonds. In this way, today’s steep discount in bond markets may present an attractive opportunity for price appreciation. At the same time, investors can potentially lock in strong yields as inflation may subside in the coming years ahead. Learn more about bond investing strategies with New York Life Investments.