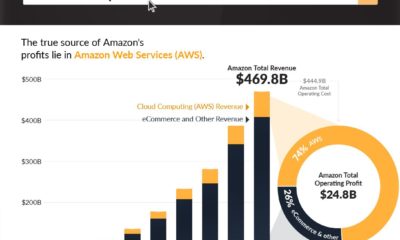
This Chart Reveals Google’s True Dominance Over the Web
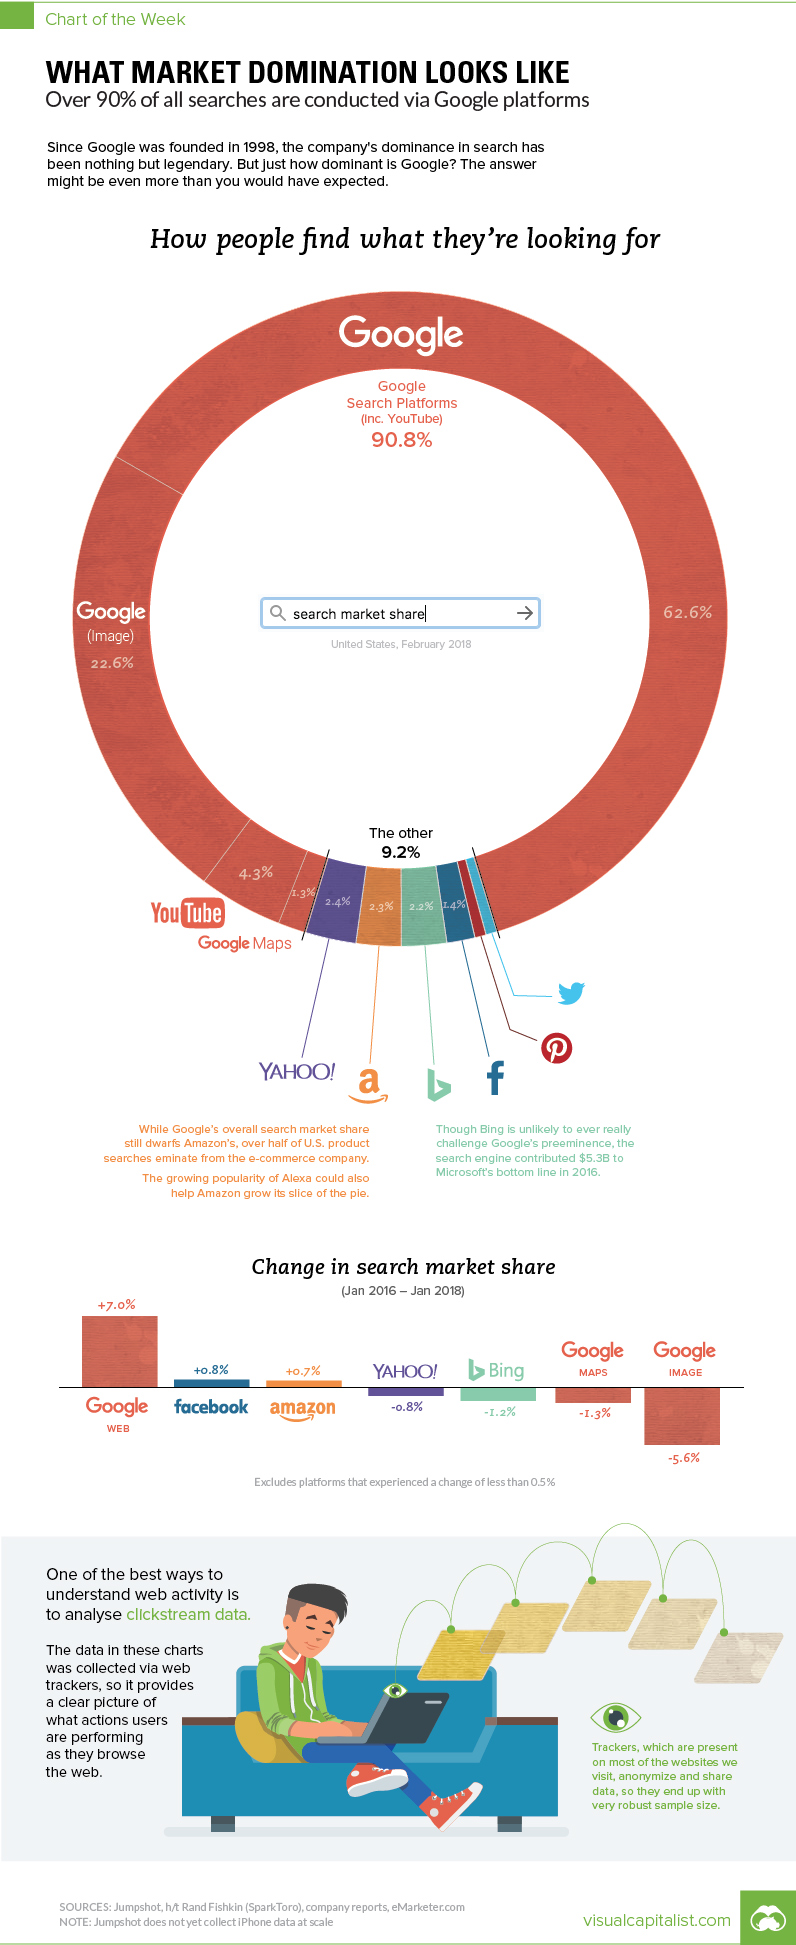
The Chart of the Week is a weekly Visual Capitalist feature on Fridays. Yes, we all know that Google is dominant in the realm of search. But at the same time, the internet is also a huge place – and building a decent searching algorithm can’t be that hard, right? This week’s chart is a bit mind-boggling, because it makes the case that Google is even more dominant than you may have guessed. Between all Google features and the search giant’s YouTube subsidiary, more than 90% of all internet searches are taking place through the company.
The Hard Data
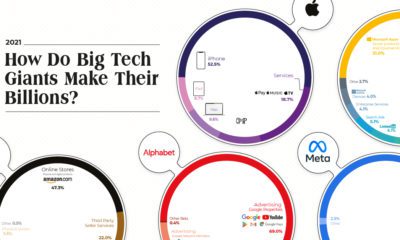
According to Jumpshot (via SparkToro), a marketing analytics firm that licenses anonymous ClickStream data from hundreds of millions of users, about 62.6% of all searches online are through Google’s core function. But that’s just the beginning, as that number doesn’t include other Google functions like image search or Google Maps, or properties such as YouTube: Together, Google holds onto an impressive 90.8% market share of web, mobile, and in-app searches – though it should be noted that the above source does not include iPhone data at scale yet.
The Google-opoly
How does Google keep up such a massive market share, and why can’t a real competitor in search emerge? The answer has to do with platforms and apps. Google’s strategy is to go where the users are, and to ensure that wherever they go, a Google search is not hard to do. Over a decade ago, this meant being the home page on every internet browser – but more recently, it’s taken the form of internet browser market share (Chrome), mobile OS market share (Android), owning the dominant video platform (YouTube), and even venturing into your dwelling with Google Home. As a result of these efforts, whenever users are searching, Google has never been far away.
Low Bids from Competition
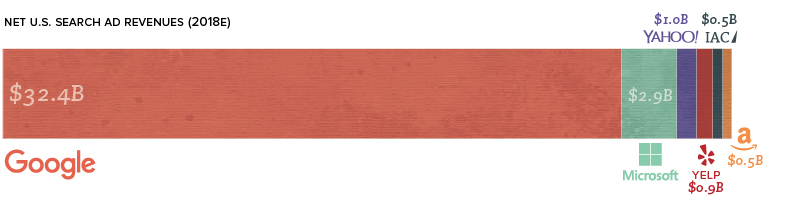
There are competitors that dare to pluck away at Google’s market share in search and ad revenue. Microsoft’s Bing is the most known one, and it has the advantage of being integrated into Microsoft products all over the globe. Meanwhile, DuckDuckGo is another name worth mentioning – the privacy-focused search engine doesn’t have anywhere near the same kind of financial backing as Microsoft, but it does differentiate its product considerably. Yet, here’s a picture of U.S. search ad revenues. Bing is small, but others are smaller. DuckDuckGo doesn’t even register.
Why can no one match Google? Part of the reason lies in the math. Google operates at an insane level, processing 3.5 billion searches per day. To get millions of people to try a different search algorithm is expensive – and to get them to keep that behavior permanently is even more expensive. The only way such change becomes feasible is if a product comes out that is 10x better than Google, and at this point, such an event seems unlikely – at least in the current ecosystem.
on Last year, stock and bond returns tumbled after the Federal Reserve hiked interest rates at the fastest speed in 40 years. It was the first time in decades that both asset classes posted negative annual investment returns in tandem. Over four decades, this has happened 2.4% of the time across any 12-month rolling period. To look at how various stock and bond asset allocations have performed over history—and their broader correlations—the above graphic charts their best, worst, and average returns, using data from Vanguard.
How Has Asset Allocation Impacted Returns?
Based on data between 1926 and 2019, the table below looks at the spectrum of market returns of different asset allocations:
We can see that a portfolio made entirely of stocks returned 10.3% on average, the highest across all asset allocations. Of course, this came with wider return variance, hitting an annual low of -43% and a high of 54%.
A traditional 60/40 portfolio—which has lost its luster in recent years as low interest rates have led to lower bond returns—saw an average historical return of 8.8%. As interest rates have climbed in recent years, this may widen its appeal once again as bond returns may rise.
Meanwhile, a 100% bond portfolio averaged 5.3% in annual returns over the period. Bonds typically serve as a hedge against portfolio losses thanks to their typically negative historical correlation to stocks.
A Closer Look at Historical Correlations
To understand how 2022 was an outlier in terms of asset correlations we can look at the graphic below:
The last time stocks and bonds moved together in a negative direction was in 1969. At the time, inflation was accelerating and the Fed was hiking interest rates to cool rising costs. In fact, historically, when inflation surges, stocks and bonds have often moved in similar directions. Underscoring this divergence is real interest rate volatility. When real interest rates are a driving force in the market, as we have seen in the last year, it hurts both stock and bond returns. This is because higher interest rates can reduce the future cash flows of these investments. Adding another layer is the level of risk appetite among investors. When the economic outlook is uncertain and interest rate volatility is high, investors are more likely to take risk off their portfolios and demand higher returns for taking on higher risk. This can push down equity and bond prices. On the other hand, if the economic outlook is positive, investors may be willing to take on more risk, in turn potentially boosting equity prices.
Current Investment Returns in Context
Today, financial markets are seeing sharp swings as the ripple effects of higher interest rates are sinking in. For investors, historical data provides insight on long-term asset allocation trends. Over the last century, cycles of high interest rates have come and gone. Both equity and bond investment returns have been resilient for investors who stay the course.