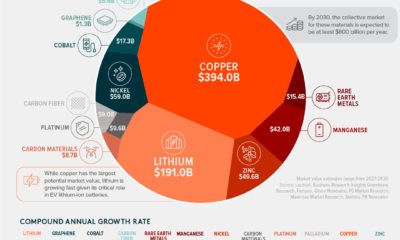
Since 1880, the Earth’s average surface temperature has risen by 0.07°C (0.13°F) every decade. That number alone may seem negligible, but over time, it adds up. In addition, the rate of temperature change has grown significantly more dramatic over time—more than doubling to 0.18°C (0.32°F) since 1981. As a result of this global warming process, environmental crises have become the most prominent risks of our time. In this global temperature graph, climate data scientist Neil R. Kaye breaks down how monthly average temperatures have changed over nearly 170 years. Temperature values have been benchmarked against pre-industrial averages (1850–1900).
What is Causing Global Warming?
The data visualization can be thought of in two halves, each reflecting significant trigger points in global warming trends:
1851-1935 Overlaps with the Second Industrial Revolution Low-High range in global temperature increase: -0.4°C to +0.6°C 1936-2020 Overlaps with the Third Industrial Revolution Low-High range in global temperature increase: +0.6°C to +1.5°C and up
The global temperature graph makes it clear that for several years now, average surface temperatures have consistently surpassed 1.5°C above their pre-industrial values. Let’s dig into these time periods a bit more closely to uncover more context around this phenomenon.
Industrial Revolutions and Advances, 1851–1935
An obvious, early anomaly on the visual worth exploring occurs between 1877–1878. During this time, the world experienced numerous unprecedented climate events, from a strong El Niño to widespread droughts. The resulting Great Famine caused the deaths of between 19–50 million people, even surpassing some of the deadliest pandemics in history. In the first five rows of the global temperature graph, several economies progressed into the Second Industrial Revolution (~1870–1914), followed by World War I (1914-1918). Overall, there was a focus on steel production and mass-produced consumer goods over these 80+ years. Although these technological advances brought immense improvements, they came at the cost of burning fossil fuels—releasing significant amounts of carbon dioxide and other greenhouse gases. It would take several more decades before scientists realized the full extent of their accumulation in the atmosphere, and their resulting relation to global warming.
The Modern World In the Red Zone, 1936–2020
The second half of the global temperature graph is marked by World War II (1939-1945) and its aftermath. As the dust settled, nations began to build themselves back up, and things really kicked into hyperdrive with the Third Industrial Revolution. As globalization and trade progressed following the 1950s, people and goods began moving around more than ever before. In addition, population growth peaked at 2.1% per year between 1965 and 1970. Industrialization patterns began to intensify further to meet the demands of a rising global population and our modern world.
The Importance of Historical Temperature Trends
The history of human development is intricately linked with global warming. While part of the rise in Earth’s surface temperature can be attributed to natural patterns of climate change, these historical trends shed some light on how much human activities are behind the rapid increase in global average temperatures in the last 85 years. The following video from Reddit user bgregory98, which leverages an extensive data set published in Nature Geoscience provides a more dramatic demonstration. It looks at the escalation of global temperatures over two thousand years. In this expansive time frame, eight of the top ten hottest years on record have occurred in the last decade alone.
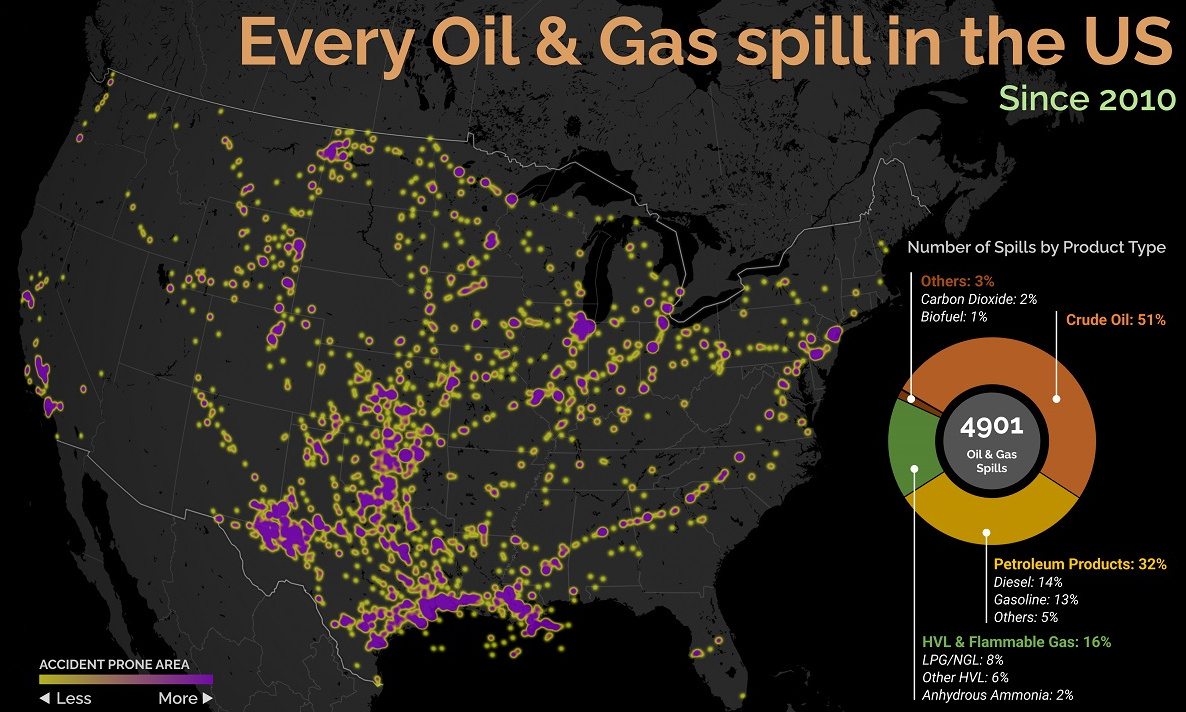
Global warming and climate change are some of the most pressing megatrends shaping our future. However, with the U.S. rejoining the Paris Climate Agreement, and the reduction of global carbon emissions highlighted as a key item at the World Economic Forum’s Davos Summit 2021, promising steps are being taken. on Aside from the obvious climate impact they bring, one other downside in particular is spills, which can lead to ecological and economic damage. These can happen due to pipeline leaks, train derailments, or other industrial disasters. This graphic from Preyash Shah provides a visual overview of every oil and gas spill in the contiguous U.S. since 2010. Data is tracked by the U.S. government’s Pipeline and Hazardous Materials Safety Administration (PHMSA).
U.S. Oil and Gas Spills (2010‒2022)
The majority of spills that have occurred come mostly from crude oil, followed by petroleum products and gas. Note that this data covers the quantity of spills and not damages or volume.
Crude oil, which makes up just over half of documented spills, is also one of the most costly. Contaminations can persist for years after a spill, and its impact on local mammals and waterfowl is particularly harsh. This has been the case with the Deepwater Horizon spill (also known as the “BP oil spill”), which experts say is still causing harm in the Gulf of Mexico. Other products with lots of spills include petroleum products such as diesel or gasoline, as well as liquefied natural gas or other volatile liquids. Interestingly, liquefied carbon dioxide can also be transported in pipelines, commonly used for carbon capture storage, but requires high pressure to maintain its state. When looking at the location of spills, it’s clear that the South Central states have experienced the highest number of disasters. In contrast, the West Coast has had substantially less activity. However, this makes much more sense when looking at the dominant oil producing states, where Texas and surrounding neighbors reign supreme. Of the 4,901 spills during this period, Texas accounts for 1,936 or roughly 40% of all oil and gas spills. This is followed by Oklahoma, which has had 407 spills and is one of the largest net exporters of oil and gas in the country.
What Causes Spills?
Oil and gas spills actually have a surprisingly long history, with one of the earliest dating back to 1889, when a spill was reported on the coast between Los Angeles and San Diego. Causes have consisted primarily of weather, natural disasters, equipment and technological malfunction, as well as human error. However, they only became a widespread problem around the halfway mark of the 20th century, when petroleum extraction and production really began to take off. This era also saw the emergence of supertankers, which can transport half a million tons of oil but therefore make the risk of spills even costlier. In fact, the biggest spill off U.S. waters after the Deepwater Horizon disaster is the 1989 Exxon Valdez spill in Alaska, when a tanker crashed into a reef and 11 million gallons of oil spilled into the Pacific Ocean.