While the majority comes from fossil fuels like natural gas (32.1%) and coal (29.9%), there are also many other minor sources that feed into the grid, ranging from biomass to geothermal. Do you know where your electricity comes from?
The Big Picture View
Today’s series of maps come from Weber State University, and they use information from the EPA’s eGRID databases to show every utility-scale power plant in the country. Use the white slider in the middle below to see how things have changed between 2007 and 2016:
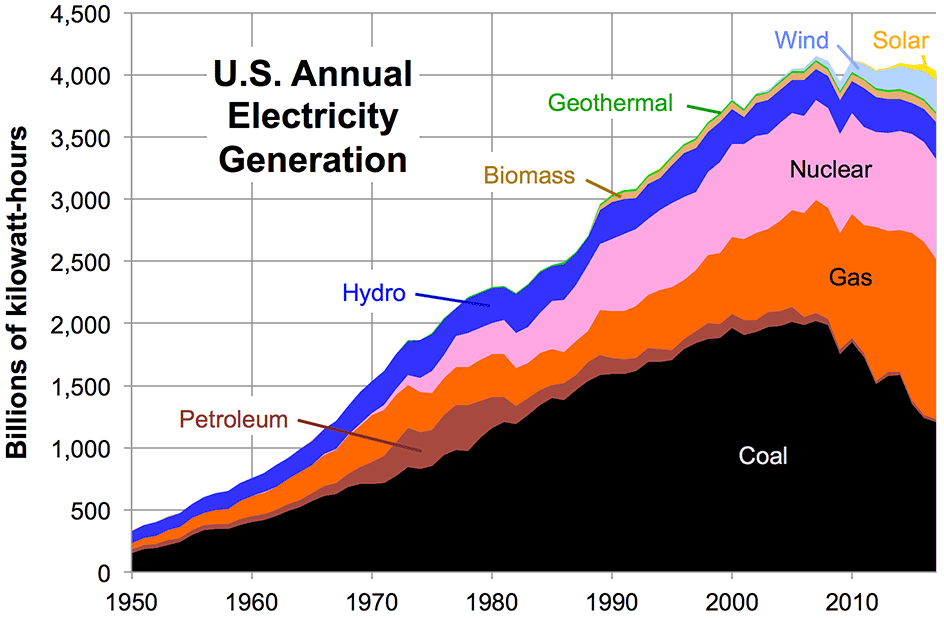
The biggest difference between the two maps is the reduced role of coal, which is no longer the most dominant energy source in the country. You can also see many smaller-scale wind and solar dots appear throughout the appropriate regions. Here’s a similar look at how the energy mix has changed in the United States over the last 70 years:
Up until the 21st century, power almost always came from fossil fuels, nuclear, or hydro sources. More recently, we can see different streams of renewables making a dent in the mix.
Maps by Source
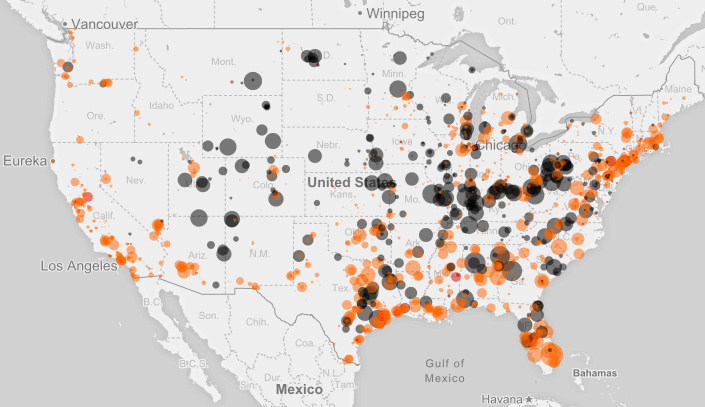
Now let’s look at how these maps look by individual sources to see regional differences more clearly. Here’s the map only showing fossil fuels.
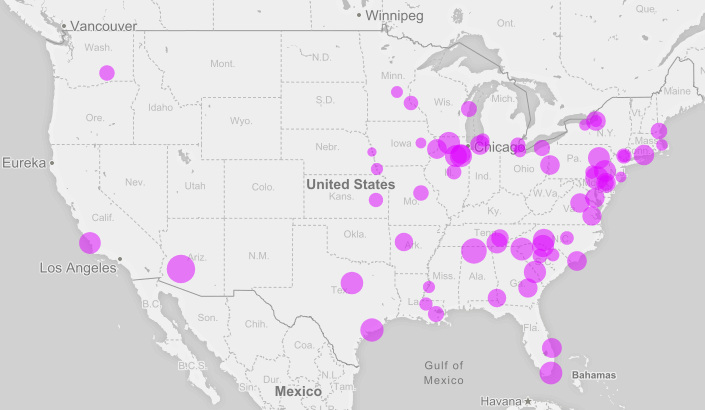
The two most prominent sources are coal (black) and natural gas (orange), and they combine to make up about 60% of total annual net generation. Now here’s just nuclear on the map:
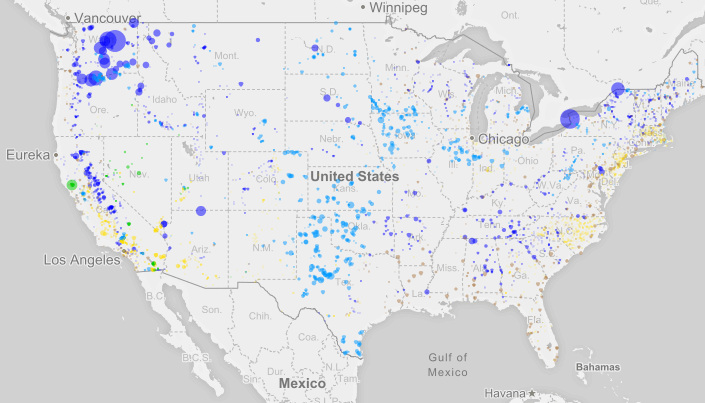
Nuclear is pretty uncommon on the western half of the country, but on the Eastern Seaboard and in the Midwest, it is a major power source. All in all, it makes up about 20% of the annual net generation mix. Finally, a look at renewable energy:
Hydro (dark blue), wind (light blue), solar (yellow), biomass (brown), and geothermal (green) all appear here. Aside from a few massive hydro installations – such as the Grand Coulee Dam in Washington State (19 million MWh per year) – most renewable installations are on a smaller scale. Generally speaking, renewable sources are also more dependent on geography. You can’t put geothermal in an area where there is no thermal energy in the ground, or wind where there is mostly calm weather. For this reason, the dispersion of green sources around the country is also quite interesting to look at. See all of the above, as well as Hawaii and Alaska, in an interactive map here. on
#1: High Reliability
Nuclear power plants run 24/7 and are the most reliable source of sustainable energy. Nuclear electricity generation remains steady around the clock throughout the day, week, and year. Meanwhile, daily solar generation peaks in the afternoon when electricity demand is usually lower, and wind generation depends on wind speeds.As the use of variable solar and wind power increases globally, nuclear offers a stable and reliable backbone for a clean electricity grid.
#2: Clean Electricity
Nuclear reactors use fission to generate electricity without any greenhouse gas (GHG) emissions.Consequently, nuclear power is the cleanest energy source on a lifecycle basis, measured in CO2-equivalent emissions per gigawatt-hour (GWh) of electricity produced by a power plant over its lifetime. The lifecycle emissions from a typical nuclear power plant are 273 times lower than coal and 163 times lower than natural gas. Furthermore, nuclear is relatively less resource-intensive, allowing for lower supply chain emissions than wind and solar plants.
#3: Stable Affordability
Although nuclear plants can be expensive to build, they are cost-competitive in the long run. Most nuclear plants have an initial lifetime of around 40 years, after which they can continue operating with approved lifetime extensions. Nuclear plants with lifetime extensions are the cheapest sources of electricity in the United States, and 88 of the country’s 92 reactors have received approvals for 20-year extensions. Additionally, according to the World Nuclear Association, nuclear plants are relatively less susceptible to fuel price volatility than natural gas plants, allowing for stable costs of electricity generation.
#4: Energy Efficiency
Nuclear’s high energy return on investment (EROI) exemplifies its exceptional efficiency. EROI measures how many units of energy are returned for every unit invested in building and running a power plant, over its lifetime. According to a 2018 study by Weissbach et al., nuclear’s EROI is 75 units, making it the most efficient energy source by some distance, with hydropower ranking second at 35 units.
#5: Sustainable Innovation
New, advanced reactor designs are bypassing many of the difficulties faced by traditional nuclear plants, making nuclear power more accessible.
Small Modular Reactors (SMRs) are much smaller than conventional reactors and are modular—meaning that their components can be transported and assembled in different locations. Microreactors are smaller than SMRs and are designed to provide electricity in remote and small market areas. They can also serve as backup power sources during emergencies.
These reactor designs offer several advantages, including lower initial capital costs, portability, and increased scalability.
A Nuclear-Powered Future
Nuclear power is making a remarkable comeback as countries work to achieve climate goals and ultimately, a state of energy utopia. Besides the 423 reactors in operation worldwide, another 56 reactors are under construction, and at least 69 more are planned for construction. Some nations, like Japan, have also reversed their attitudes toward nuclear power, embracing it as a clean and reliable energy source for the future. CanAlaska is a leading exploration company in the Athabasca Basin, the Earth’s richest uranium depository. Click here to learn more now. In part 3 of the Road to Energy Utopia series, we explore the unique properties of uranium, the fuel that powers nuclear reactors.