However, as simple or as light-hearted as it appears at first glance, today’s infographic actually provides an invaluable amount of context on a subject that is often mired in the ugly details of mathematical models, multipliers, and policy implications.
Earth’s Temperature Over 22,000 Years
Today’s infographic from XKCD shows the Earth’s temperature since the last ice age glaciation, which was 22,000 years ago. It was around this time that there were vast ice sheets covering North America, northern Europe, and Asia.
This infographic does two things very well. First, it gives us an idea of temperature changes over time in a relatable fashion, but it also gives us a sense of time scale.
Temperature Changes in Context
Temperatures were cold at the end of the last glaciation, which was around 20,000 BCE – about 4°C cooler than they were during the modern era. Boston and New York would have been covered in thick ice at that time. Fast-forward half of the span of the infographic, and temperatures have increased to near modern levels (the average between 1961-1990) in about 11,000 years. This would have been around 9,000 BCE, which is around the time the very first humans started farming way back in today’s Middle East region. From there, temperatures continue to increase for another 4,000 years, peaking around the time that the wheel was invented. This was around 5,000 BCE, which is still considered to be the end of the Stone Age. This is an era still well before the Ancient Egyptians rose to prominence. The Earth cools again. By the time of the birth of Jesus, temperatures are close again to to those in the modern era. It continues to cool until Shakespearian times, which were in the middle of what is called the “Little Ice Age”. Finally, after the Industrial Revolution, temperatures spike at a rate not seen before. In the short span of just a century or so, temperatures are back at their previous peak that occurred when the wheel was invented – roughly 7,000 years ago. Sources used: Shakun et al (2012), Marcott et al (2013), Annan and Hargreaves (2013), HadCRUT4, IPCC,
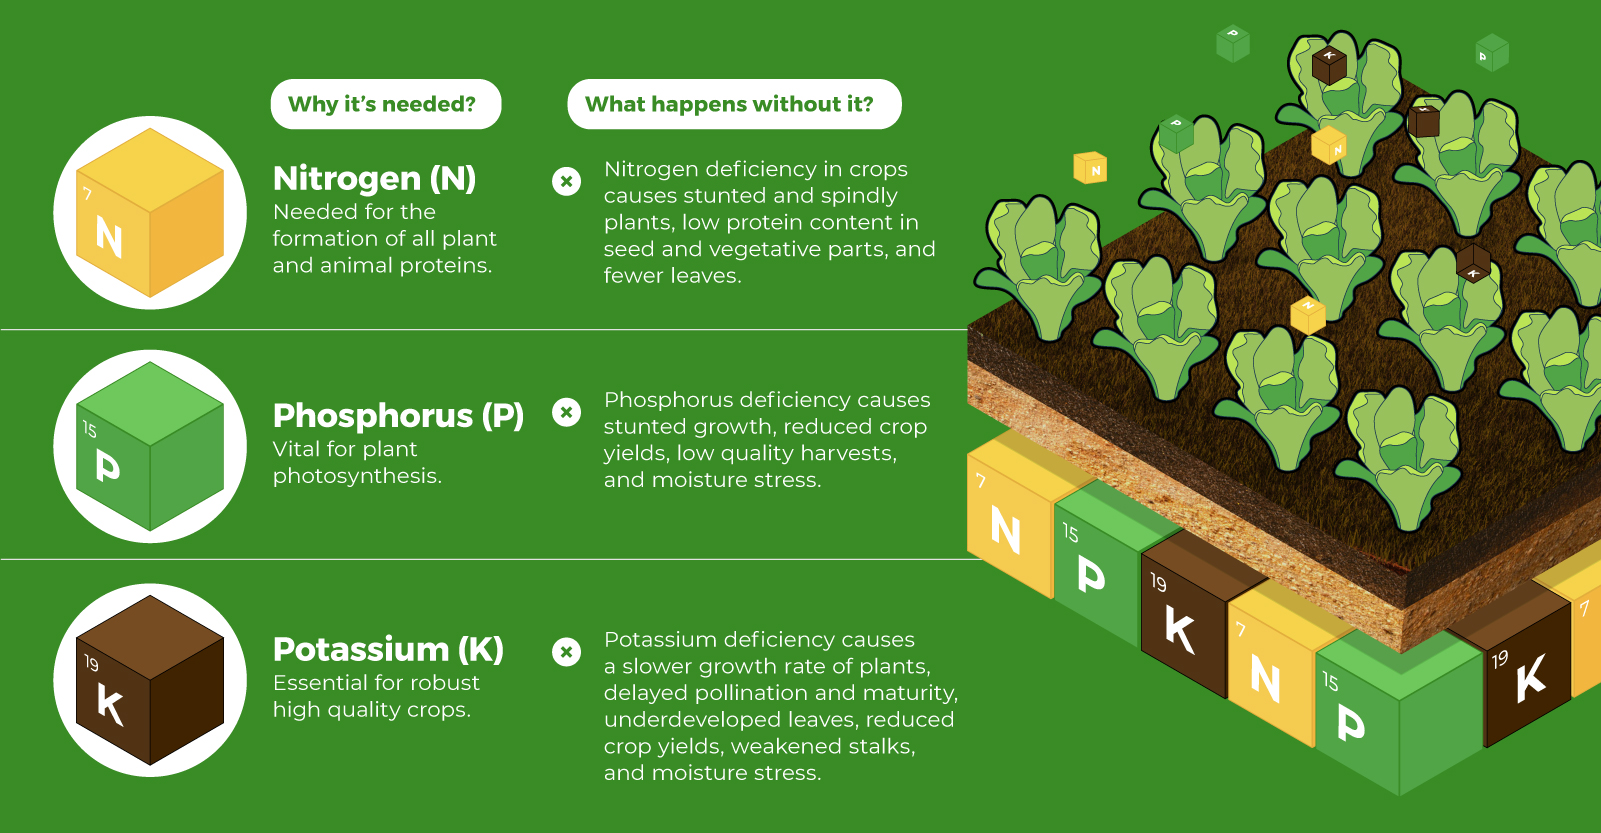
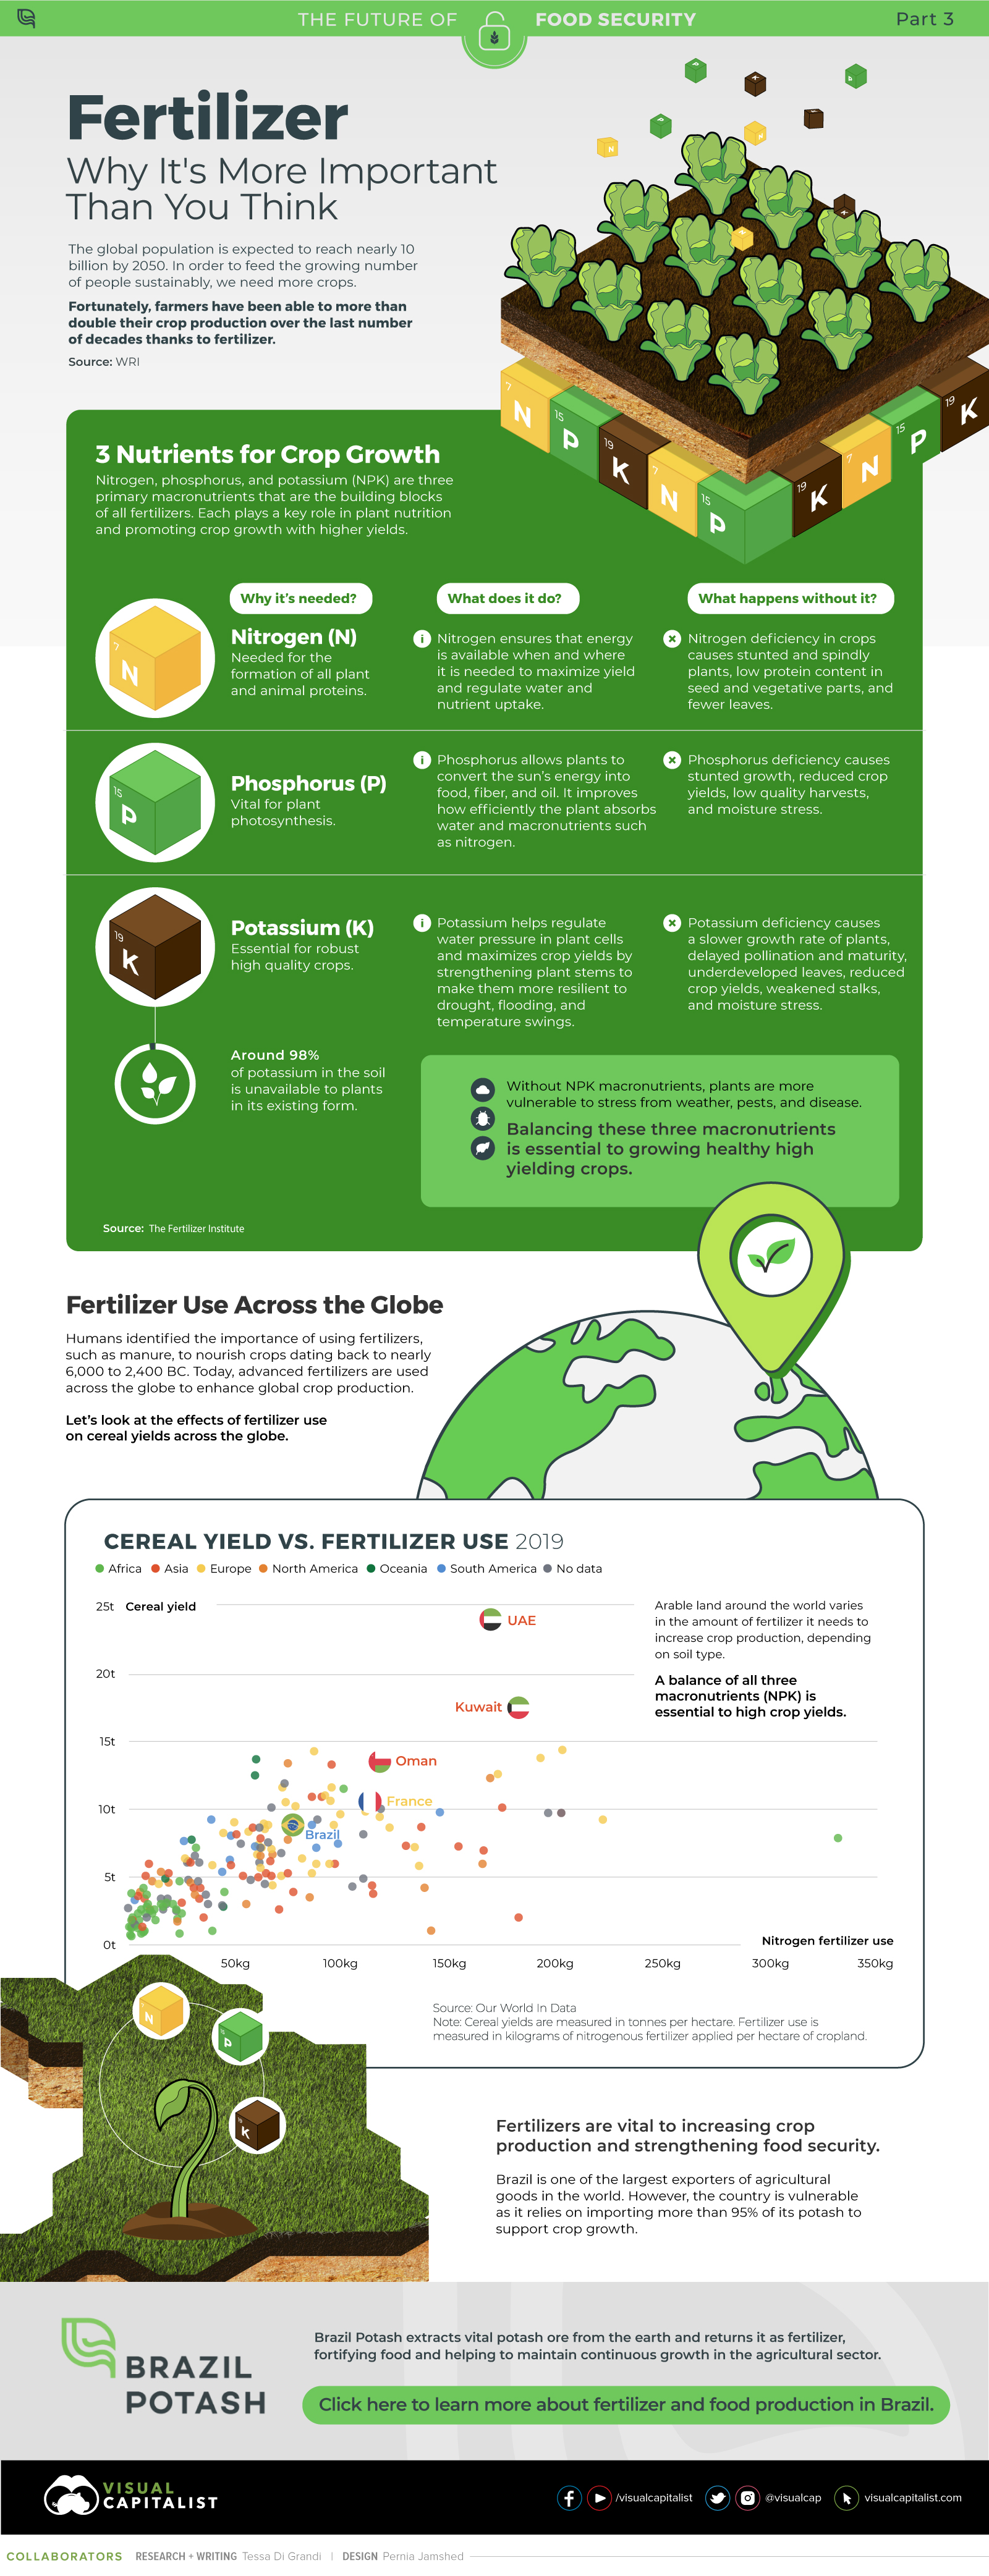
on Over recent decades, farmers have been able to more than double their production of crops thanks to fertilizers and the vital nutrients they contain. When crops are harvested, the essential nutrients are taken away with them to the dining table, resulting in the depletion of these nutrients in the soil. To replenish these nutrients, fertilizers are needed, and the cycle continues. The above infographic by Brazil Potash shows the role that each macronutrient plays in growing healthy, high-yielding crops.
Food for Growth
Nitrogen, phosphorus, and potassium (NPK) are three primary macronutrients that are the building blocks of the global fertilizer industry. Each plays a key role in plant nutrition and promoting crop growth with higher yields. Let’s take a look at how each macronutrient affects plant growth. If crops lack NPK macronutrients, they become vulnerable to various stresses caused by weather conditions, pests, and diseases. Therefore, it is crucial to maintain a balance of all three macronutrients for the production of healthy, high-yielding crops.
The Importance of Fertilizers
Humans identified the importance of using fertilizers, such as manure, to nourish crops dating back to nearly 6,000 to 2,400 BC. As agriculture became more intensive and large-scale, farmers began to experiment with different types of fertilizers. Today advanced chemical fertilizers are used across the globe to enhance global crop production. There are a myriad of factors that affect soil type, and so the farmable land must have a healthy balance of all three macronutrients to support high-yielding, healthy crops. Consequently, arable land around the world varies in the amount and type of fertilizer it needs. Fertilizers play an integral role in strengthening food security, and a supply of locally available fertilizer is needed in supporting global food systems in an ever-growing world. Brazil is one of the largest exporters of agricultural goods in the world. However, the country is vulnerable as it relies on importing more than 95% of its potash to support crop growth. Brazil Potash is developing a new potash project in Brazil to ensure a stable domestic source of this nutrient-rich fertilizer critical for global food security. Click here to learn more about fertilizer and food production in Brazil.