The Money Project is an ongoing collaboration between Visual Capitalist and Texas Precious Metals that seeks to use intuitive visualizations to explore the origins, nature, and use of money.
How Much Money Have Humans Created?
The dollar amounts are so staggering, that simply telling you how much money humans have created probably wouldn’t convey the magnitude. However, by using data visualization in this video, we can relate numbers in the millions, billions, and trillions to create the context to make it more understandable.
Starting With Context
The median U.S. household income of $54,000 is a number that most people can relate to. It’s enough money to save up to buy a car, or maybe even a house depending on where you live. Multiply that income by eight, and that number is now big enough to count as being in the top 1% of earners. People in the “one percent” make at least $430,000 per year. Famous celebrities and businesspeople have fortunes that dwarf those of many “one percenters”. Actor George Clooney, for example, has a net worth of $180 million. Meanwhile, author J.K. Rowling is estimated to have a net worth of roughly $1 billion according to Forbes. Zuckerberg takes things to a whole new level. His net worth worth is $53 billion, thanks to the value of Facebook stock. Lastly, Bill Gates regularly tops the “richest people” lists with a wealth of $75 billion – though lately that number has been a little higher based on stock fluctuations. However, even the wealth of the richest human on Earth is not enough to get up to our unit of measurement that we use in the video: each square is equal to $100 billion.
The World’s Money
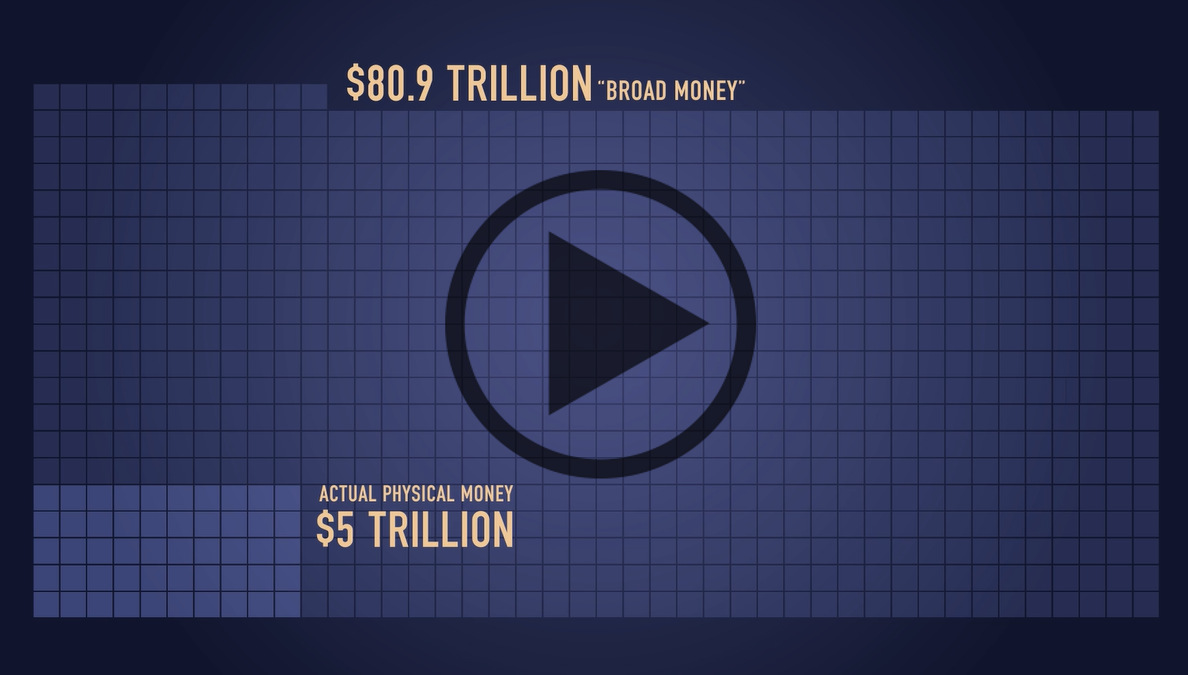
Some of the world’s biggest companies take up just a few squares with our unit of measurement. ExxonMobil for example has a market capitalization of about $350 billion, and the world’s largest public company by market capitalization, Apple, is at about $600 billion. The total of the world’s physical currency – all coins and bills denominated in dollars, euros, yen, and other currencies – is about $5 trillion. Meanwhile, if we add checking accounts to the equation, the number for the amount of money in the world goes up to $28.6 trillion according to the CIA World Factbook. This is called “narrow money”. Add all money market, savings, and time deposits, and the number jumps up to $80.9 trillion – or “broad money”. But that’s nothing compared to the world of Wall Street.
Wall Street
All stock markets added together are worth $70 trillion, and global debt is $199 trillion. That’s all impressive, but the derivatives market takes the cake. Derivatives are contracts between parties that derive value from the performance of underlying assets, indices, or entities. On the low end, the notional value of the derivatives market is estimated to be a whopping $630 trillion according to the Bank of International Settlements. However, that only accounts for OTC (over-the-counter) derivatives, and the truth is that no one actually knows the size of the derivatives market. It’s been estimated by some that it could be as high as $1.2 quadrillion, and others estimate it could be even higher. There are many financial critics who worry about the risk that these contracts pile onto the global financial system. With the sheer size of the derivative market dwarfing all others, it’s understandable why business mogul Warren Buffett has called derivatives “financial weapons of mass destruction”.
About the Money Project
The Money Project aims to use intuitive visualizations to explore ideas around the very concept of money itself. Founded in 2015 by Visual Capitalist and Texas Precious Metals, the Money Project will look at the evolving nature of money, and will try to answer the difficult questions that prevent us from truly understanding the role that money plays in finance, investments, and accumulating wealth. on The good news is that the Federal Reserve, U.S. Treasury, and Federal Deposit Insurance Corporation are taking action to restore confidence and take the appropriate measures to help provide stability in the market. With this in mind, the above infographic from New York Life Investments looks at the factors that impact bonds, how different types of bonds have historically performed across market environments, and the current bond market volatility in a broader context.
Bond Market Returns
Bonds had a historic year in 2022, posting one of the worst returns ever recorded. As interest rates rose at the fastest pace in 40 years, it pushed bond prices lower due to their inverse relationship. In a rare year, bonds dropped 13%.
Source: FactSet, 01/02/2023.
Bond prices are only one part of a bond’s total return—the other looks at the income a bond provides. As interest rates have increased in the last year, it has driven higher bond yields in 2023.
Source: YCharts, 3/20/2023.
With this recent performance in mind, let’s look at some other key factors that impact the bond market.
Factors Impacting Bond Markets
Interest rates play a central role in bond market dynamics. This is because they affect a bond’s price. When rates are rising, existing bonds with lower rates are less valuable and prices decline. When rates are dropping, existing bonds with higher rates are more valuable and their prices rise. In March, the Federal Reserve raised rates 25 basis points to fall within the 4.75%-5.00% range, a level not seen since September 2007. Here are projections for where the federal funds rate is headed in 2023:
Federal Reserve Projection*: 5.1% Economist Projections**: 5.3%
*Based on median estimates in the March summary of quarterly economic projections.**Projections based on March 10-15 Bloomberg economist survey. Together, interest rates and the macroenvironment can have a positive or negative effect on bonds.
Positive
Here are three variables that may affect bond prices in a positive direction:
Lower Inflation: Reduces likelihood of interest rate hikes. Lower Interest Rates: When rates are falling, bond prices are typically higher. Recession: Can prompt a cut in interest rates, boosting bond prices.
Negative
On the other hand, here are variables that may negatively impact bond prices:
Higher Inflation: Can increase the likelihood of the Federal Reserve to raise interest rates. Rising Interest Rates: Interest rate hikes lead bond prices to fall. Weaker Fundamentals: When a bond’s credit risk gets worse, its price can drop. Credit risk indicates the chance of a default, the risk of a bond issuer not making interest payments within a given time period.
Bonds have been impacted by these negative factors since inflation started rising in March 2021.
Fixed Income Opportunities
Below, we show the types of bonds that have had the best performance during rising rates and recessions.
Source: Derek Horstmeyer, George Mason University 12/3/2022. As we can see, U.S. ultrashort bonds performed the best during rising rates. Mortgage bonds outperformed during recessions, averaging 11.4% returns, but with higher volatility. U.S. long-term bonds had 7.7% average returns, the best across all market conditions. In fact, they were also a close second during recessions. When rates are rising, ultrashort bonds allow investors to capture higher rates when they mature, often with lower historical volatility.
A Closer Look at Bond Market Volatility
While bond market volatility has jumped this year, current dislocations may provide investment opportunities. Bond dislocations allow investors to buy at lower prices, factoring in that the fundamental quality of the bond remains strong. With this in mind, here are two areas of the bond market that may provide opportunities for investors:
Investment-Grade Corporate Bonds: Higher credit quality makes them potentially less vulnerable to increasing interest rates. Intermediate Bonds (2-10 Years): Allow investors to lock in higher rates.
Both types of bonds focus on quality and capturing higher yields when faced with challenging market conditions.
Finding the Upside
Much of the volatility seen in the banking sector was due to banks buying bonds during the pandemic—or even earlier—at a time when interest rates were historically low. Since then, rates have climbed considerably. Should rates moderate or stop increasing, this may present better market conditions for bonds. In this way, today’s steep discount in bond markets may present an attractive opportunity for price appreciation. At the same time, investors can potentially lock in strong yields as inflation may subside in the coming years ahead. Learn more about bond investing strategies with New York Life Investments.