But its massive global footprint didn’t grow overnight. While Facebook is the most popular social network in many countries, this traction didn’t happen overnight. And in other places, it still hasn’t quite taken off. To see Facebook’s path to domination, we mapped each country’s most popular social network from 2008‒2020. The data was tabulated by Vincenzo Cosenza at Vincos.it by examining annual traffic data from Alexa and SimilarWeb.
Facebook Grows From the Americas to Southeast Asia
What famously started as Mark Zuckerberg’s late-night intoxicated project called Facemash—a “hot or not” type website for students at Harvard University—soon evolved into the world’s predominant social network. Before 2008, the social network landscape was populated by social network pioneers such as Myspace and Hi5. Google’s Orkut was the most popular network in Brazil and India, and Friendster found a foothold in Southeast Asia. But the Facebook wave came in earnest. By 2009, the social media giant took the title of most popular network for the bulk of the Americas, Europe, South Asia, and Oceania, with Orkut in Brazil being the sole holdout until 2011. The story was similar in Africa, as increasing internet traffic data pointed to Facebook dominating the social network landscape across the continent (minus a temporary LinkedIn surge in 2017 for Zimbabwe, Ethiopia, Kenya, and Cameroon). By the beginning of 2020, Facebook was measured as the leading social network site in 151 out of 167 measured countries, or over 90%.
China and Russia Resist Facebook’s Pull
The social giant’s growth, however, didn’t come without resistance. China’s most popular social networking website has been Tencent’s Qzone since the mid-2000s. WeChat—a popular all-in-one messaging platform—does not technically qualify for the above map as a “social networking website”, but the app now has more than 1.2 billion MAUs. Facebook had attempted to gain ground in the country but was banned in 2009. Similarly in Iran, Facebook was also blocked first in 2009 and then intermittently since. Instead, Iran’s most popular social networks have been Persian sites Cloob and Facenama between 2009‒2016. Facebook did manage to capture the #1 spot briefly in 2011, but since then, they’ve been displaced by Facebook-owned Instagram. The other countries that Facebook has had trouble capturing, despite not being blocked, are Russia and many former Soviet republics. There, social network dominance has switched regularly between the networks VKontakte and Odnoklassniki, both owned by Mail.ru, a Russian internet giant.
Facebook’s Monopoly Over Mobile Social Networks
As big of a footprint as Facebook has on social networking, the tech giant’s reach is magnified when factoring in mobile apps that it also owns. In 2020, the company saw 1.3 billion MAUs on Facebook’s Messenger app, 2 billion MAUs on the world’s most popular messaging app WhatsApp, and just under 1.2 billion MAUs on photo sharing network Instagram. By Facebook’s own estimates in its Q3 2020 reporting, its core products are used by more than 3.2 billion people every month. That means that 40% of Earth’s population (7.8 billion in December 2020) uses Facebook-owned social media. The question now is if Facebook’s domination will grow further, or if it’ll begin to subside. With increasing scrutiny of tech giants, the company is facing massive antitrust lawsuits in the U.S. by federal and state authorities, and other countries are stepping up potential regulation as well. At the same time, Facebook is struggling to reach younger audiences in developed countries, which have increasingly turned to Snap and TikTok instead for social media. Did 2020 mark the height of Facebook’s global empire, or is it just another milestone on the path towards further domination? on But fast forward to the end of last week, and SVB was shuttered by regulators after a panic-induced bank run. So, how exactly did this happen? We dig in below.
Road to a Bank Run
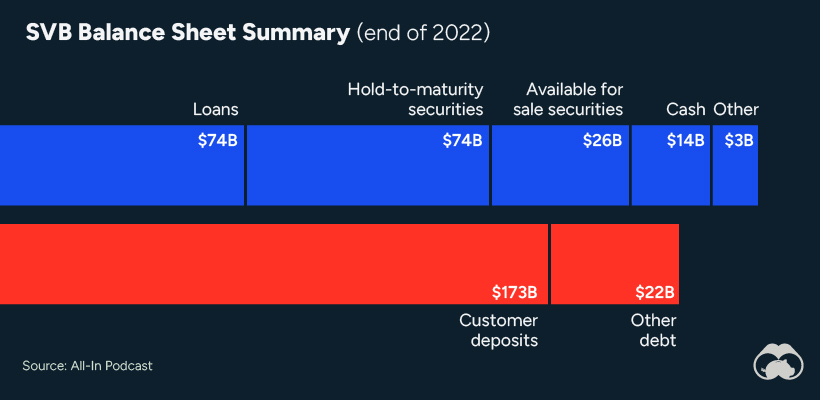
SVB and its customers generally thrived during the low interest rate era, but as rates rose, SVB found itself more exposed to risk than a typical bank. Even so, at the end of 2022, the bank’s balance sheet showed no cause for alarm.
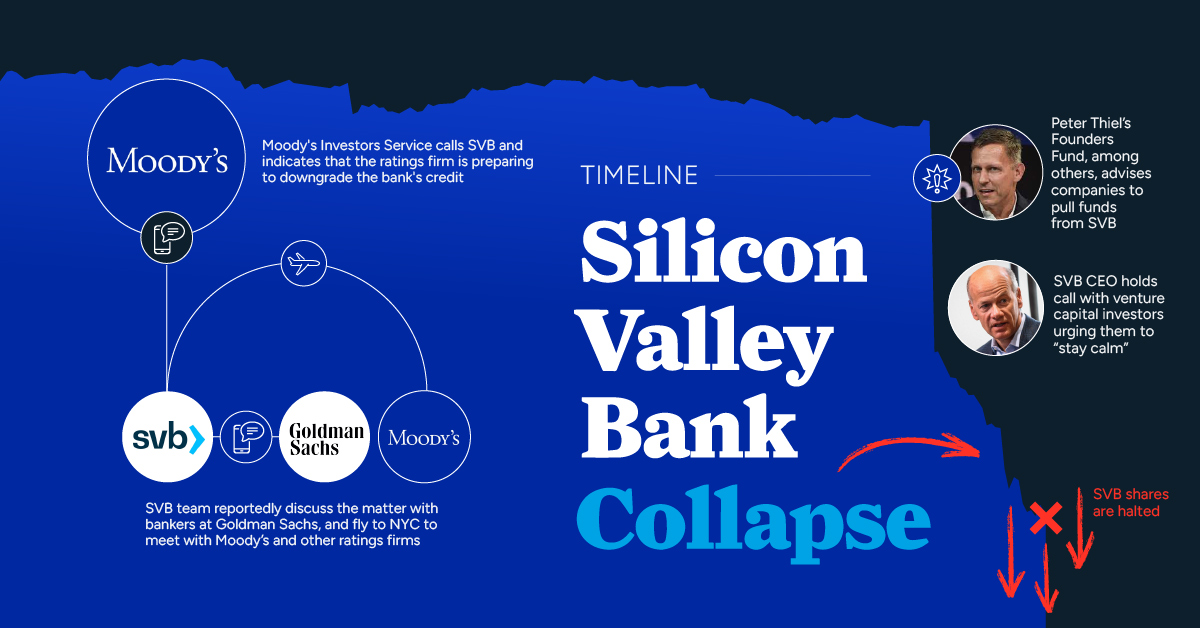
As well, the bank was viewed positively in a number of places. Most Wall Street analyst ratings were overwhelmingly positive on the bank’s stock, and Forbes had just added the bank to its Financial All-Stars list. Outward signs of trouble emerged on Wednesday, March 8th, when SVB surprised investors with news that the bank needed to raise more than $2 billion to shore up its balance sheet. The reaction from prominent venture capitalists was not positive, with Coatue Management, Union Square Ventures, and Peter Thiel’s Founders Fund moving to limit exposure to the 40-year-old bank. The influence of these firms is believed to have added fuel to the fire, and a bank run ensued. Also influencing decision making was the fact that SVB had the highest percentage of uninsured domestic deposits of all big banks. These totaled nearly $152 billion, or about 97% of all deposits. By the end of the day, customers had tried to withdraw $42 billion in deposits.
What Triggered the SVB Collapse?
While the collapse of SVB took place over the course of 44 hours, its roots trace back to the early pandemic years. In 2021, U.S. venture capital-backed companies raised a record $330 billion—double the amount seen in 2020. At the time, interest rates were at rock-bottom levels to help buoy the economy. Matt Levine sums up the situation well: “When interest rates are low everywhere, a dollar in 20 years is about as good as a dollar today, so a startup whose business model is “we will lose money for a decade building artificial intelligence, and then rake in lots of money in the far future” sounds pretty good. When interest rates are higher, a dollar today is better than a dollar tomorrow, so investors want cash flows. When interest rates were low for a long time, and suddenly become high, all the money that was rushing to your customers is suddenly cut off.” Source: Pitchbook Why is this important? During this time, SVB received billions of dollars from these venture-backed clients. In one year alone, their deposits increased 100%. They took these funds and invested them in longer-term bonds. As a result, this created a dangerous trap as the company expected rates would remain low. During this time, SVB invested in bonds at the top of the market. As interest rates rose higher and bond prices declined, SVB started taking major losses on their long-term bond holdings.
Losses Fueling a Liquidity Crunch
When SVB reported its fourth quarter results in early 2023, Moody’s Investor Service, a credit rating agency took notice. In early March, it said that SVB was at high risk for a downgrade due to its significant unrealized losses. In response, SVB looked to sell $2 billion of its investments at a loss to help boost liquidity for its struggling balance sheet. Soon, more hedge funds and venture investors realized SVB could be on thin ice. Depositors withdrew funds in droves, spurring a liquidity squeeze and prompting California regulators and the FDIC to step in and shut down the bank.
What Happens Now?
While much of SVB’s activity was focused on the tech sector, the bank’s shocking collapse has rattled a financial sector that is already on edge.
The four biggest U.S. banks lost a combined $52 billion the day before the SVB collapse. On Friday, other banking stocks saw double-digit drops, including Signature Bank (-23%), First Republic (-15%), and Silvergate Capital (-11%).
Source: Morningstar Direct. *Represents March 9 data, trading halted on March 10.
When the dust settles, it’s hard to predict the ripple effects that will emerge from this dramatic event. For investors, the Secretary of the Treasury Janet Yellen announced confidence in the banking system remaining resilient, noting that regulators have the proper tools in response to the issue.
But others have seen trouble brewing as far back as 2020 (or earlier) when commercial banking assets were skyrocketing and banks were buying bonds when rates were low.