Far from a new invention, municipal bonds have been shaping U.S. communities for more than 200 years. In today’s infographic from New York Life Investments, we take a look back at their long history.
Early Beginnings – 1800s
1812: First Official Issue New York City issues a general obligation bond for a canal. 1817-1825: Facilitating Economic Growth A few years later, 42 separate bond issues help fund the successful Erie Canal project. 1843: Growing Popularity Municipal debt sits at about $25 million. Over the next two decades, this total increases exponentially to fund urban improvement and free public education. Circa 1865: Railroad Expansion For a few years after the American Civil War, a great deal of debt is issued to build railroads. 1873: The Panic of 1873 Excessive investment in railroads, real estate, and nonessential services leads to the downfall of the large bank Jay Cooke and Co., smaller firms, and the stock market. Many state and local governments default, temporarily halting municipal financing.
The 20th Century
1913: Exception Granted U.S. Congress introduces a permanent federal income tax, and specifically excludes municipal bond income from taxation. Note: today, a portion of municipal bonds are taxable. 1930: Expansion in the West In the midst of the Great Depression, voters approve $35 million in funding to build the Golden Gate Bridge. 1939-1945: Diverted Resources With financial resources directed to the military in WWII, municipal debt falls. By 1945, total debt sits at less than $20 billion. 1960: Exponential Growth Only 25 years later, outstanding public debt—the total amount owed to creditors—more than triples to $66 billion. 1971: Investor Protection Municipal bond insurance is introduced. That same year, insured municipal bonds finance the construction of hospital facilities in Alaska—bringing essential services and investment opportunities to a remote area. 1975: Marketplace Stewardship Bringing further reassurance to the municipal bond market, the Municipal Securities Rulemaking Board (MSRB) is introduced to establish regulations for dealers, and for advisors at a later date. 1981: Continued Growth Outstanding public debt reaches $361 billion.
Modern Day
2009-2010: Economic Recovery More than $181 billion of federally-subsidized Build America Bonds are issued by state and local governments to help stimulate the economy after the financial crisis. 2016-2018: Investor Dollars at Work In recent years, state and local debt has financed many important projects across the country.
2016: The New York State Thruway Authority issues $850 million in bonds to finance a portion of the new NY Bridge Project. 2017: California’s Department of Water Resources issues $428 million in bonds for the maintenance and construction of its water management infrastructure. 2018: The Denver International Airport issues $2.5B in bonds to finance capital improvements, the largest airport revenue bond in municipal bond history.
2018: Helping People and the Planet Sustainable applications for municipal bonds continue to grow, with Californian voters approving $2 billion in financing for supportive housing. In addition, state and local governments issue $4.9 billion in U.S. municipal green bonds. Today: A Sizable Investment Opportunity As financing spans the nation, the U.S. municipal bond market is both large and active:
$3.8 trillion capital market One million outstanding securities $11.6 billion in par traded per/day 40,000 daily trades
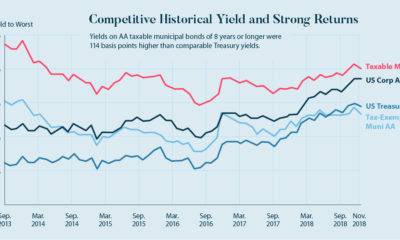
Not only that, municipals have offered a compelling after-tax yield. For example, high yield municipals offered 121% of the after-tax yield of high yield corporates as of September 30, 2019.
The Foundation of Infrastructure
For over 200 years, municipal bonds have provided critical financing to build hospitals, schools, highways, airports, and more. Today, two out of three infrastructure projects in the U.S. are financed by municipal bonds. Additionally, municipals have weathered almost every economic storm, providing much-needed capital stimulus during some of the deepest U.S. recessions. As history continues to unfold, municipals hold great potential for issuers, communities, and investors. on Last year, stock and bond returns tumbled after the Federal Reserve hiked interest rates at the fastest speed in 40 years. It was the first time in decades that both asset classes posted negative annual investment returns in tandem. Over four decades, this has happened 2.4% of the time across any 12-month rolling period. To look at how various stock and bond asset allocations have performed over history—and their broader correlations—the above graphic charts their best, worst, and average returns, using data from Vanguard.
How Has Asset Allocation Impacted Returns?
Based on data between 1926 and 2019, the table below looks at the spectrum of market returns of different asset allocations:
We can see that a portfolio made entirely of stocks returned 10.3% on average, the highest across all asset allocations. Of course, this came with wider return variance, hitting an annual low of -43% and a high of 54%.
A traditional 60/40 portfolio—which has lost its luster in recent years as low interest rates have led to lower bond returns—saw an average historical return of 8.8%. As interest rates have climbed in recent years, this may widen its appeal once again as bond returns may rise.
Meanwhile, a 100% bond portfolio averaged 5.3% in annual returns over the period. Bonds typically serve as a hedge against portfolio losses thanks to their typically negative historical correlation to stocks.
A Closer Look at Historical Correlations
To understand how 2022 was an outlier in terms of asset correlations we can look at the graphic below:
The last time stocks and bonds moved together in a negative direction was in 1969. At the time, inflation was accelerating and the Fed was hiking interest rates to cool rising costs. In fact, historically, when inflation surges, stocks and bonds have often moved in similar directions. Underscoring this divergence is real interest rate volatility. When real interest rates are a driving force in the market, as we have seen in the last year, it hurts both stock and bond returns. This is because higher interest rates can reduce the future cash flows of these investments. Adding another layer is the level of risk appetite among investors. When the economic outlook is uncertain and interest rate volatility is high, investors are more likely to take risk off their portfolios and demand higher returns for taking on higher risk. This can push down equity and bond prices. On the other hand, if the economic outlook is positive, investors may be willing to take on more risk, in turn potentially boosting equity prices.
Current Investment Returns in Context
Today, financial markets are seeing sharp swings as the ripple effects of higher interest rates are sinking in. For investors, historical data provides insight on long-term asset allocation trends. Over the last century, cycles of high interest rates have come and gone. Both equity and bond investment returns have been resilient for investors who stay the course.