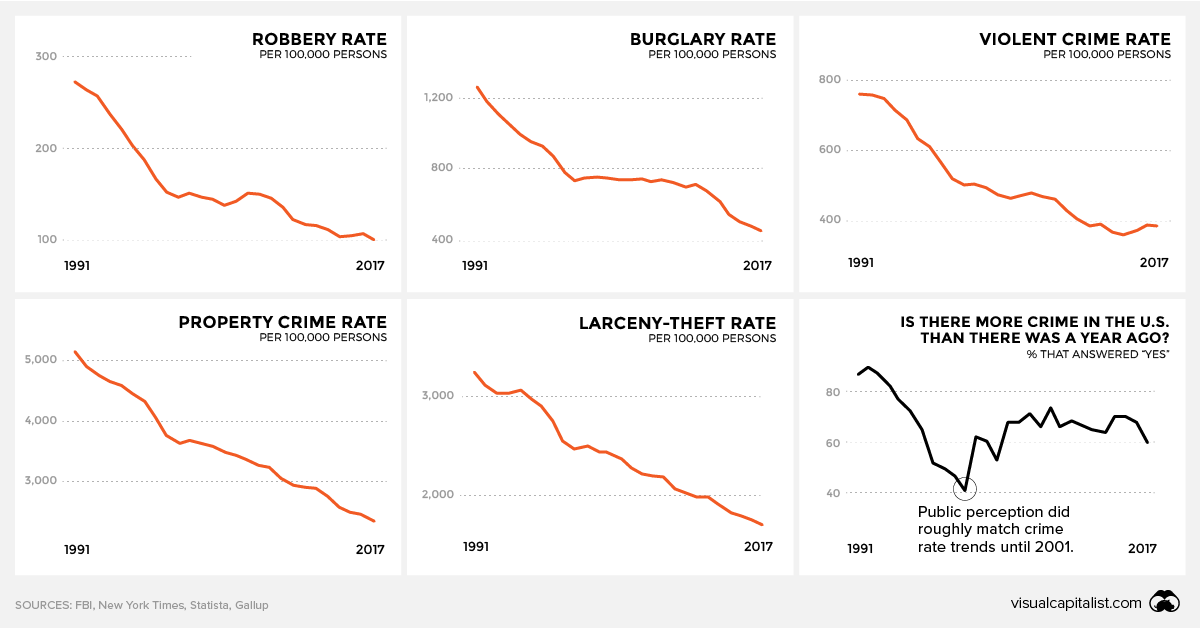
Since the late 1980s, Gallup has been polling people on their perception of crime in the United States, and consistently, the majority of respondents indicate that they see crime as becoming more prevalent. As well, a recent poll showed that more than two-thirds of Americans feel that today’s youth are less safe from crime and harm than the previous generation. Even the highest ranking members of the government have been suggesting that the country is in the throes of a crime wave. — Jeff Sessions, Former Attorney General Is crime actually more prevalent in society? Today’s graphic, amalgamating crime rate data from the FBI, shows a very different reality.
Data vs Perception
In the early ’90s, crime in the U.S. was an undeniable concern – particularly in struggling urban centers. The country’s murder rate was nearly double what it is today, and statistics for all types of crime were through the roof. Since that era, crime rates in the United States have undergone a remarkably steady decline, but public perception has been slow to catch up. In a 2016 survey, 57% of registered voters said crime in the U.S. had gotten worse since 2008, despite crime rates declining by double-digit percentages during that time period. There are many theories as to why crime rates took such a dramatic U-turn, and while that matter is still a subject for debate, there’s clear data on who is and isn’t being arrested.
Are Millennials Killing Crime?
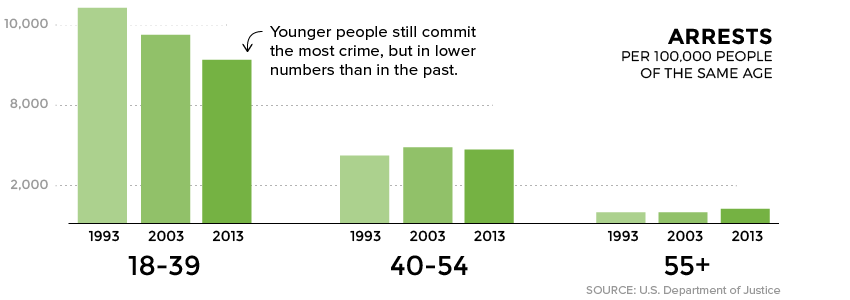
Media outlets have accused millennials of the killing off everything from department stores to commuting by car, but there’s another behavior this generation is eschewing as well – criminality. Compared to previous generations, people under the age of 39 are simply being arrested in smaller numbers. In fact, much of the decline in overall crime can be attributed to people in this younger age bracket. In contrast, the arrest rate for older Americans actually rose slightly.
There’s no telling whether the overall trend will continue. In fact, the most recent data shows that the murder rate has ticked up ever-so-slightly in recent years, while violent and property crimes continue to be on the decline.
A Global Perspective
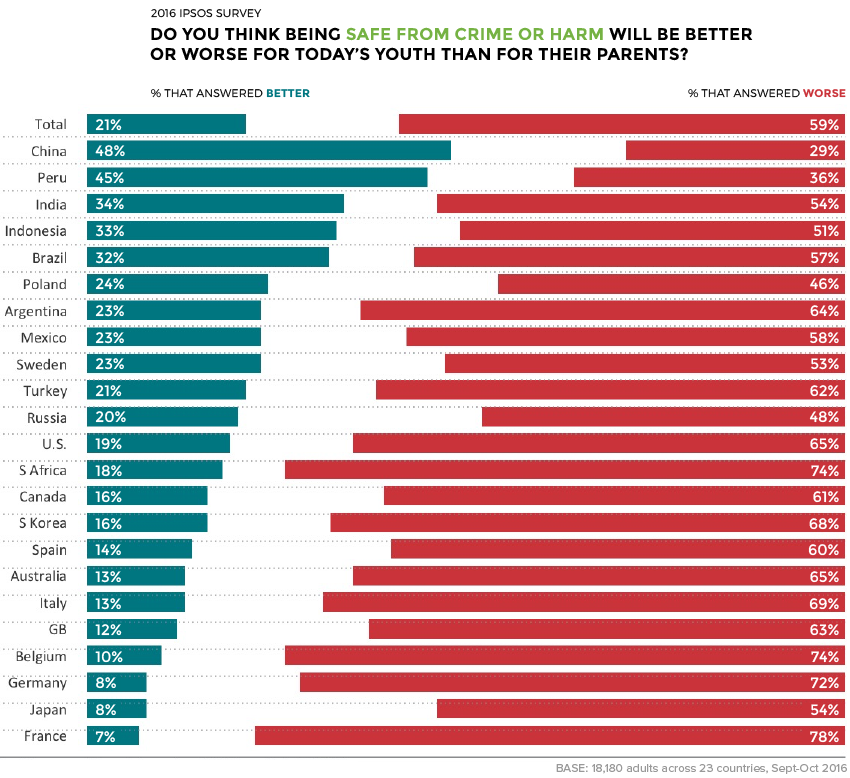
Perceptions of increasing criminality are echoed in many other developed economies as well. From Italy to South Korea, the prevailing sentiment is that youth are living in a society that is less safe than in previous generations.
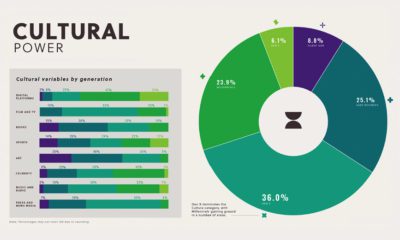
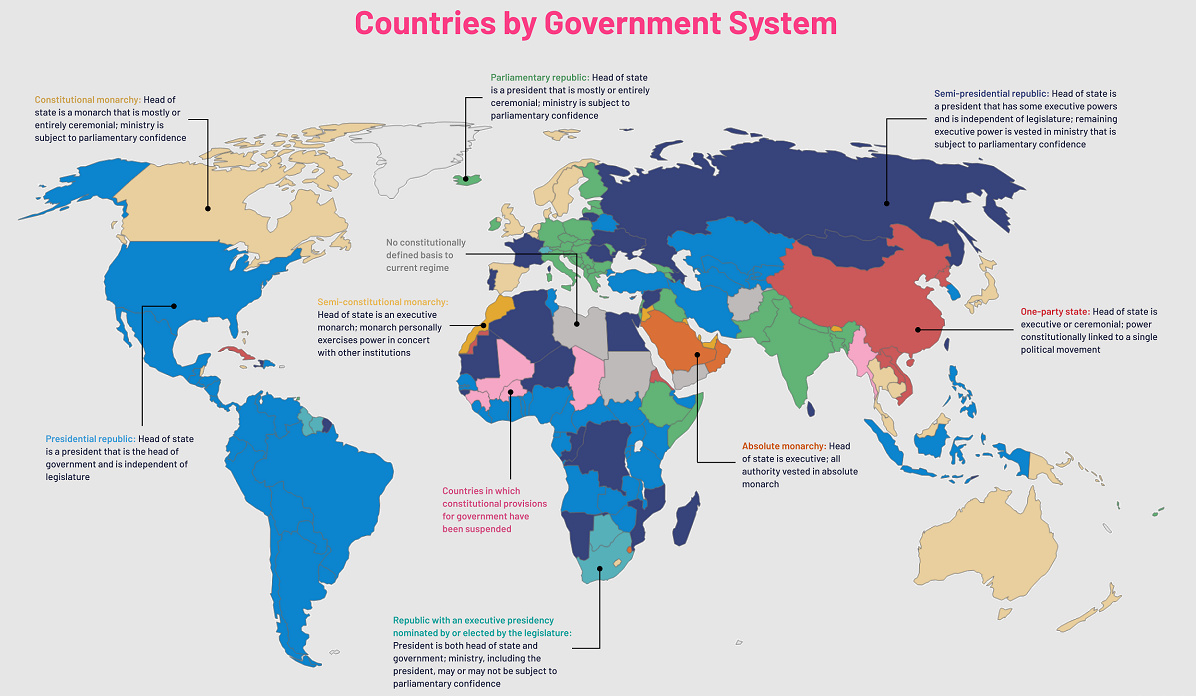
As the poll above demonstrates, perception gaps exist in somewhat unexpected places. In Sweden, where violent crime is actually increasing, 53% of people believe that crime will be worse for today’s youth. Contrast that with Australia, where crime rates have declined in a similar pattern as in the United States – yet, more than two-thirds of Aussie respondents believe that crime will be worse for today’s youth. One significant counterpoint to this trend is China, where respondents felt that crime was less severe today than in the past. on Even while political regimes across these countries have changed over time, they’ve largely followed a few different types of governance. Today, every country can ultimately be classified into just nine broad forms of government systems. This map by Truman Du uses information from Wikipedia to map the government systems that rule the world today.
Countries By Type of Government
It’s important to note that this map charts government systems according to each country’s legal framework. Many countries have constitutions stating their de jure or legally recognized system of government, but their de facto or realized form of governance may be quite different. Here is a list of the stated government system of UN member states and observers as of January 2023: Let’s take a closer look at some of these systems.
Monarchies
Brought back into the spotlight after the death of Queen Elizabeth II of England in September 2022, this form of government has a single ruler. They carry titles from king and queen to sultan or emperor, and their government systems can be further divided into three modern types: constitutional, semi-constitutional, and absolute. A constitutional monarchy sees the monarch act as head of state within the parameters of a constitution, giving them little to no real power. For example, King Charles III is the head of 15 Commonwealth nations including Canada and Australia. However, each has their own head of government. On the other hand, a semi-constitutional monarchy lets the monarch or ruling royal family retain substantial political powers, as is the case in Jordan and Morocco. However, their monarchs still rule the country according to a democratic constitution and in concert with other institutions. Finally, an absolute monarchy is most like the monarchies of old, where the ruler has full power over governance, with modern examples including Saudi Arabia and Vatican City.
Republics
Unlike monarchies, the people hold the power in a republic government system, directly electing representatives to form government. Again, there are multiple types of modern republic governments: presidential, semi-presidential, and parliamentary. The presidential republic could be considered a direct progression from monarchies. This system has a strong and independent chief executive with extensive powers when it comes to domestic affairs and foreign policy. An example of this is the United States, where the President is both the head of state and the head of government. In a semi-presidential republic, the president is the head of state and has some executive powers that are independent of the legislature. However, the prime minister (or chancellor or equivalent title) is the head of government, responsible to the legislature along with the cabinet. Russia is a classic example of this type of government. The last type of republic system is parliamentary. In this system, the president is a figurehead, while the head of government holds real power and is validated by and accountable to the parliament. This type of system can be seen in Germany, Italy, and India and is akin to constitutional monarchies. It’s also important to point out that some parliamentary republic systems operate slightly differently. For example in South Africa, the president is both the head of state and government, but is elected directly by the legislature. This leaves them (and their ministries) potentially subject to parliamentary confidence.
One-Party State
Many of the systems above involve multiple political parties vying to rule and govern their respective countries. In a one-party state, also called a single-party state or single-party system, only one political party has the right to form government. All other political parties are either outlawed or only allowed limited participation in elections. In this system, a country’s head of state and head of government can be executive or ceremonial but political power is constitutionally linked to a single political movement. China is the most well-known example of this government system, with the General Secretary of the Communist Party of China ruling as the de facto leader since 1989.
Provisional
The final form of government is a provisional government formed as an interim or transitional government. In this system, an emergency governmental body is created to manage political transitions after the collapse of a government, or when a new state is formed. Often these evolve into fully constitutionalized systems, but sometimes they hold power for longer than expected. Some examples of countries that are considered provisional include Libya, Burkina Faso, and Chad.