In order to help with this difficult situation, global governments have had to increase their expenditures to deal with higher healthcare costs, unemployment, food insecurity, and to help businesses to survive. Countries have taken on new debt to provide financial support for these measures, which has resulted in the highest global debt levels in half a century. To analyze the extent of global debt, we’ve compiled debt-to-GDP data by country from the most recent World Economic Outlook report by the IMF.
Global Debt by Country: The Top 10 Most Indebted Nations
The debt-to-GDP ratio is a simple metric that compares a country’s public debt to its economic output. By comparing how much a country owes and how much it produces in a year, economists can measure a country’s theoretical ability to pay off its debt. Let’s take a look at the top 10 countries in terms of debt-to-GDP: Source: World Economic Outlook Report (October 2021 Edition) Japan, Sudan, and Greece top the list with debt-to-GDP ratios well above 200%, followed by Eritrea (175%), Cape Verde (160%), and Italy (154%). Japan’s debt level won’t come as a surprise to most. In 2010, it became the first country to reach a debt-to-GDP ratio 200%, and it now sits at 257%. In order to finance new debt, the Japanese government issues bonds which get bought up primarily by the Bank of Japan. By the end of 2020, the Bank of Japan owned 45% of government debt outstanding.
What is the main risk of a high debt-to-GDP ratio?
A rapid increase in government debt is a major cause for concern. Generally, the higher a country’s debt-to-GDP ratio is, the higher chance that country could default on its debt, therefore creating a financial panic in the markets. The World Bank published a study showing that countries that maintained a debt-to-GDP ratio of over 77% for prolonged periods of time experienced economic slowdowns. COVID-19 has worsened a debt crisis that has been brewing since the 2008 global recession. A report from the International Monetary Fund (IMF) shows that at least 100 countries will have to reduce expenditures on health, education, and social protection. Also, 30 countries in the developing world have high levels of debt distress, meaning they’re experiencing great difficulties in servicing their debt. This crisis is hitting poor and middle-income countries harder than rich countries. Wealthier countries are borrowing to launch fiscal stimulus packages while low and middle income countries cannot afford such measures, potentially resulting in wider global inequality.
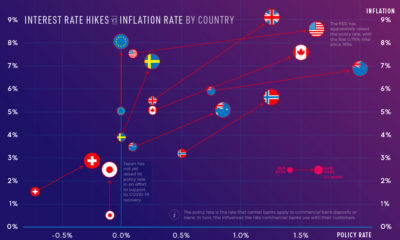
The IMF Warns of Interest Rates
Global debt reached $226 trillion by the end of 2020, seeing the biggest one-year increase since World War II. Borrowing by governments accounted for slightly over half of the $28 trillion increase, bringing global public debt ratio to a record of 99% of GDP. As interest rates rise, IMF officials warn that higher interest rates will diminish the impact of fiscal spending, and cause debt sustainability concerns to intensify. “The risks will be magnified if global interest rates rise faster than expected and growth falters,” the officials wrote. “A significant tightening of financial conditions would heighten the pressure on the most highly indebted governments, households, and firms. If the public and private sectors are forced to deleverage simultaneously, growth prospects will suffer.” Editor’s note: All data used in our visualization was extracted from the World Economic Outlook Report (October 2021 Edition) and The World Bank. We will update this data when the new report is available in April 2022. on Last year, stock and bond returns tumbled after the Federal Reserve hiked interest rates at the fastest speed in 40 years. It was the first time in decades that both asset classes posted negative annual investment returns in tandem. Over four decades, this has happened 2.4% of the time across any 12-month rolling period. To look at how various stock and bond asset allocations have performed over history—and their broader correlations—the above graphic charts their best, worst, and average returns, using data from Vanguard.
How Has Asset Allocation Impacted Returns?
Based on data between 1926 and 2019, the table below looks at the spectrum of market returns of different asset allocations:
We can see that a portfolio made entirely of stocks returned 10.3% on average, the highest across all asset allocations. Of course, this came with wider return variance, hitting an annual low of -43% and a high of 54%.
A traditional 60/40 portfolio—which has lost its luster in recent years as low interest rates have led to lower bond returns—saw an average historical return of 8.8%. As interest rates have climbed in recent years, this may widen its appeal once again as bond returns may rise.
Meanwhile, a 100% bond portfolio averaged 5.3% in annual returns over the period. Bonds typically serve as a hedge against portfolio losses thanks to their typically negative historical correlation to stocks.
A Closer Look at Historical Correlations
To understand how 2022 was an outlier in terms of asset correlations we can look at the graphic below:
The last time stocks and bonds moved together in a negative direction was in 1969. At the time, inflation was accelerating and the Fed was hiking interest rates to cool rising costs. In fact, historically, when inflation surges, stocks and bonds have often moved in similar directions. Underscoring this divergence is real interest rate volatility. When real interest rates are a driving force in the market, as we have seen in the last year, it hurts both stock and bond returns. This is because higher interest rates can reduce the future cash flows of these investments. Adding another layer is the level of risk appetite among investors. When the economic outlook is uncertain and interest rate volatility is high, investors are more likely to take risk off their portfolios and demand higher returns for taking on higher risk. This can push down equity and bond prices. On the other hand, if the economic outlook is positive, investors may be willing to take on more risk, in turn potentially boosting equity prices.
Current Investment Returns in Context
Today, financial markets are seeing sharp swings as the ripple effects of higher interest rates are sinking in. For investors, historical data provides insight on long-term asset allocation trends. Over the last century, cycles of high interest rates have come and gone. Both equity and bond investment returns have been resilient for investors who stay the course.