But how much profit do these companies make on a per employee basis? This visualization uncovers the answer by comparing the 20 companies with the most and least returns per employee, using calculations from Tipalti (based on the Fortune 500 list).
Top 20: Most Profit per Employee
Diving right in, the companies that make the most money per employee may surprise you. Housing giants Fannie Mae and Freddie Mac take two of the top three spots, bringing in $1.9 million and $1.0 million per employee respectively in 2019. The two U.S. government sponsored enterprises (GSEs) are major players in the secondary mortgage market, buying and repackaging nearly half the mortgages in the country. The duo was allowed to retain their profits as of October 2019, instead of returning them to the U.S. Treasury. Apple employs 137,000 people—the largest workforce by far among the 40 companies profiled—but still makes $403,328 per employee. Facebook is the only other tech giant to bring in more money per employee at $411,308.
Bottom 20: Least Profit per Employee
On the other end of the spectrum, Uber is one of the most well-known companies currently bleeding profits, losing $316K per employee. In fact, the ride-hailing service lost approximately $1.8 billion in the second quarter of 2020 alone. COVID-19 has also had an intense effect on some of the companies at the bottom end of the profit per employee spectrum. Chesapeake Energy and Frontier Communications are just two examples that have filed for Chapter 11 bankruptcy in recent months—they each lost $134K and $322K per employee in 2019 respectively. —James Hammond, CEO of BankruptcyData
Profit per Employee by Sector
When all the companies in the Fortune 500 are taken into account, sector-specific numbers reveal interesting trends. Financials bring in the most profit per employee at $116K, while Food and Drug Stores see 17 times less profit at $6.7K per employee. In fact, eight out of the top 20 most profitable companies are found in the financial sector. Interestingly, as a whole, the energy sector comes in third place in terms of profit per employee at $86K—that said, nine out of the bottom 20 least profitable companies are also found in this highly volatile industry. Though the vast majority of businesses impacted by COVID-19 have been small to mid-sized companies, the above calculations also show that Fortune 500 companies are not safe, either. on Similar to the the precedent set by the music industry, many news outlets have also been figuring out how to transition into a paid digital monetization model. Over the past decade or so, The New York Times (NY Times)—one of the world’s most iconic and widely read news organizations—has been transforming its revenue model to fit this trend. This chart from creator Trendline uses annual reports from the The New York Times Company to visualize how this seemingly simple transition helped the organization adapt to the digital era.
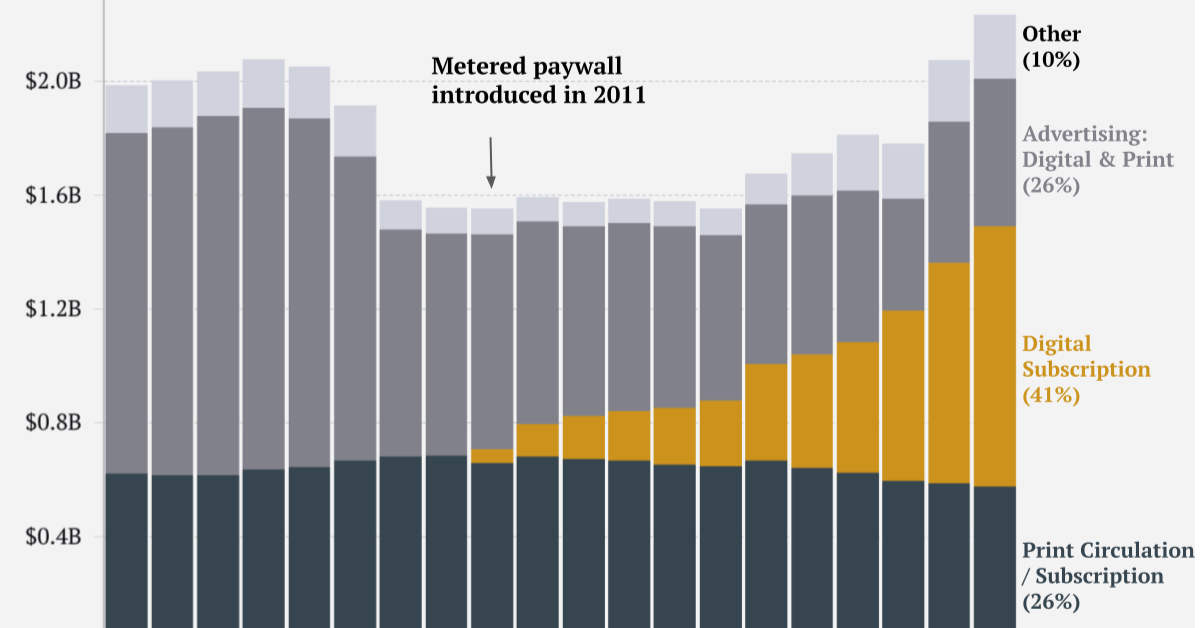
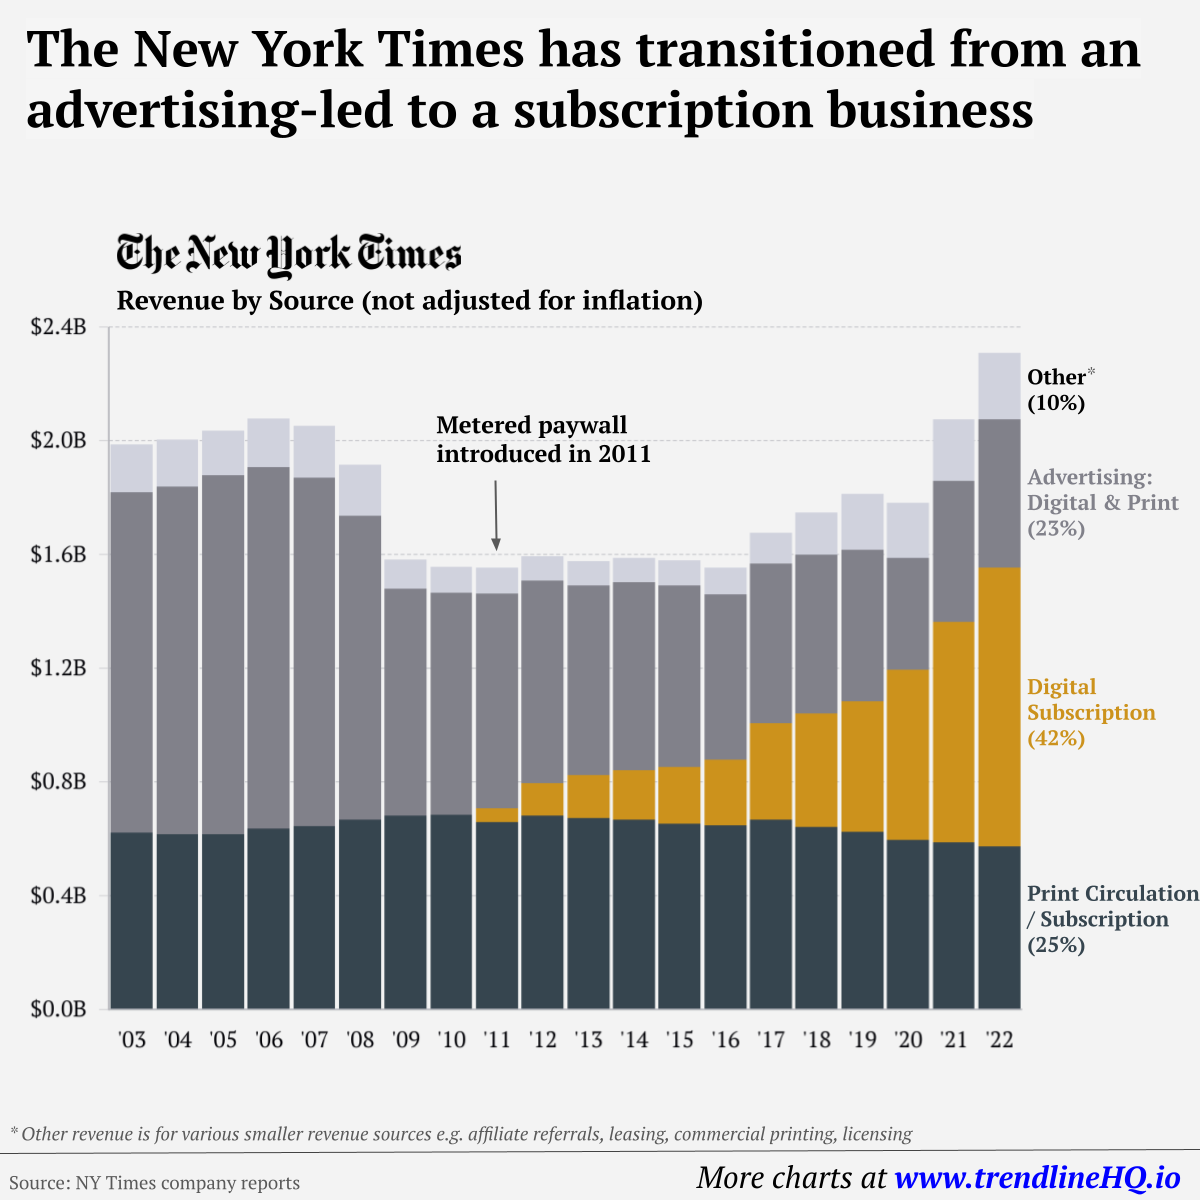
The New York Times’ Revenue Transition
The NY Times has always been one of the world’s most-widely circulated papers. Before the launch of its digital subscription model, it earned half its revenue from print and online advertisements. The rest of its income came in through circulation and other avenues including licensing, referrals, commercial printing, events, and so on. But after annual revenues dropped by more than $500 million from 2006 to 2010, something had to change. In 2011, the NY Times launched its new digital subscription model and put some of its online articles behind a paywall. It bet that consumers would be willing to pay for quality content. And while it faced a rocky start, with revenue through print circulation and advertising slowly dwindling and some consumers frustrated that once-available content was now paywalled, its income through digital subscriptions began to climb. After digital subscription revenues first launched in 2011, they totaled to $47 million of revenue in their first year. By 2022 they had climbed to $979 million and accounted for 42% of total revenue.
Why Are Readers Paying for News?
More than half of U.S. adults subscribe to the news in some format. That (perhaps surprisingly) includes around four out of 10 adults under the age of 35. One of the main reasons cited for this was the consistency of publications in covering a variety of news topics. And given the NY Times’ popularity, it’s no surprise that it recently ranked as the most popular news subscription.