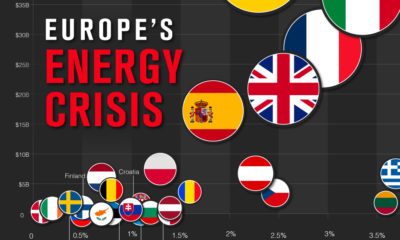
Of course, the money required to address these concerns must come from somewhere—and that’s where the EU’s budget comes in. Each member state contributes revenue, but it’s been argued that not everyone is pulling their weight. Today’s chart is based on budget data from the European Commission, and ranks the member states who contributed the most, and least, to the 2018 EU budget. Specifically, we’ve charted the net contributions—measured as the country’s total contribution less expenditures—on an absolute and per capita basis. We also break down the EU’s main revenue sources and areas of expenditure for the year.
An Unequal Share
Perhaps not surprisingly, Germany and the UK are the top two net contributors in absolute terms. Combined, these two powerhouses had a GDP (PPP) of over €5 trillion in 2018. At the other end of the scale, Poland tops the list of net beneficiaries with a deficit of -€11,632 million—more than double that of second-place Hungary. In the wake of the European sovereign debt crisis, Greece and Portugal slide into fourth and fifth place respectively. When population is taken into account, these rankings shift dramatically. Per capita, the Netherlands tops the list with €284 contributed per resident, whereas Luxembourg lands in last place with a deficit of -€2,710. The small country is home to many EU institutions, resulting in high administrative spending: in 2018, administration amounted to 80% of total expenditures. Here’s a full ranking of the 28 member states, in both absolute (€M) and per capita (€ per resident) terms: It’s easy to see what the net beneficiaries might gain from the EU—but what about the top net contributors? Beyond straight budgetary allocations, member states have access to a single open market, and benefit from the political clout of 28 united countries, among other perks.
Following the Money
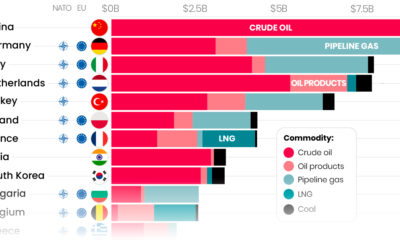
So, how does the EU collect its revenue, and what does it spend its money on? Revenue is broken down into four main categories: Revenue might also include a budget surplus from the previous year, or net adjustments made to previous years’ financials. On the other side of the budget, the EU has a wide variety of expenditures, broken down into six main categories: The 2018 budget resulted in a surplus of two billion Euros, but will it be balanced in future years?
The 2020 Budget and Beyond
The EU’s current budgetary framework ends in 2020. A proposal for the 2021–2027 budget has already been set forth, and council meetings are ongoing. With Brexit’s twice-postponed deadline looming, the UK’s departure will leave a “sizable gap” in the EU budget. This could leave member states scrambling to find additional revenue sources and ways to reduce expenditures. on Both figures surpassed analyst expectations by a wide margin, and in January, the unemployment rate hit a 53-year low of 3.4%. With the recent release of February’s numbers, unemployment is now reported at a slightly higher 3.6%. A low unemployment rate is a classic sign of a strong economy. However, as this visualization shows, unemployment often reaches a cyclical low point right before a recession materializes.
Reasons for the Trend
In an interview regarding the January jobs data, U.S. Treasury Secretary Janet Yellen made a bold statement: While there’s nothing wrong with this assessment, the trend we’ve highlighted suggests that Yellen may need to backtrack in the near future. So why do recessions tend to begin after unemployment bottoms out?
The Economic Cycle
The economic cycle refers to the economy’s natural tendency to fluctuate between periods of growth and recession. This can be thought of similarly to the four seasons in a year. An economy expands (spring), reaches a peak (summer), begins to contract (fall), then hits a trough (winter). With this in mind, it’s reasonable to assume that a cyclical low in the unemployment rate (peak employment) is simply a sign that the economy has reached a high point.
Monetary Policy
During periods of low unemployment, employers may have a harder time finding workers. This forces them to offer higher wages, which can contribute to inflation. For context, consider the labor shortage that emerged following the COVID-19 pandemic. We can see that U.S. wage growth (represented by a three-month moving average) has climbed substantially, and has held above 6% since March 2022. The Federal Reserve, whose mandate is to ensure price stability, will take measures to prevent inflation from climbing too far. In practice, this involves raising interest rates, which makes borrowing more expensive and dampens economic activity. Companies are less likely to expand, reducing investment and cutting jobs. Consumers, on the other hand, reduce the amount of large purchases they make. Because of these reactions, some believe that aggressive rate hikes by the Fed can either cause a recession, or make them worse. This is supported by recent research, which found that since 1950, central banks have been unable to slow inflation without a recession occurring shortly after.
Politicians Clash With Economists
The Fed has raised interest rates at an unprecedented pace since March 2022 to combat high inflation. More recently, Fed Chairman Jerome Powell warned that interest rates could be raised even higher than originally expected if inflation continues above target. Senator Elizabeth Warren expressed concern that this would cost Americans their jobs, and ultimately, cause a recession. Powell remains committed to bringing down inflation, but with the recent failures of Silicon Valley Bank and Signature Bank, some analysts believe there could be a pause coming in interest rate hikes. Editor’s note: just after publication of this article, it was confirmed that U.S. interest rates were hiked by 25 basis points (bps) by the Federal Reserve.